Fig. 2.
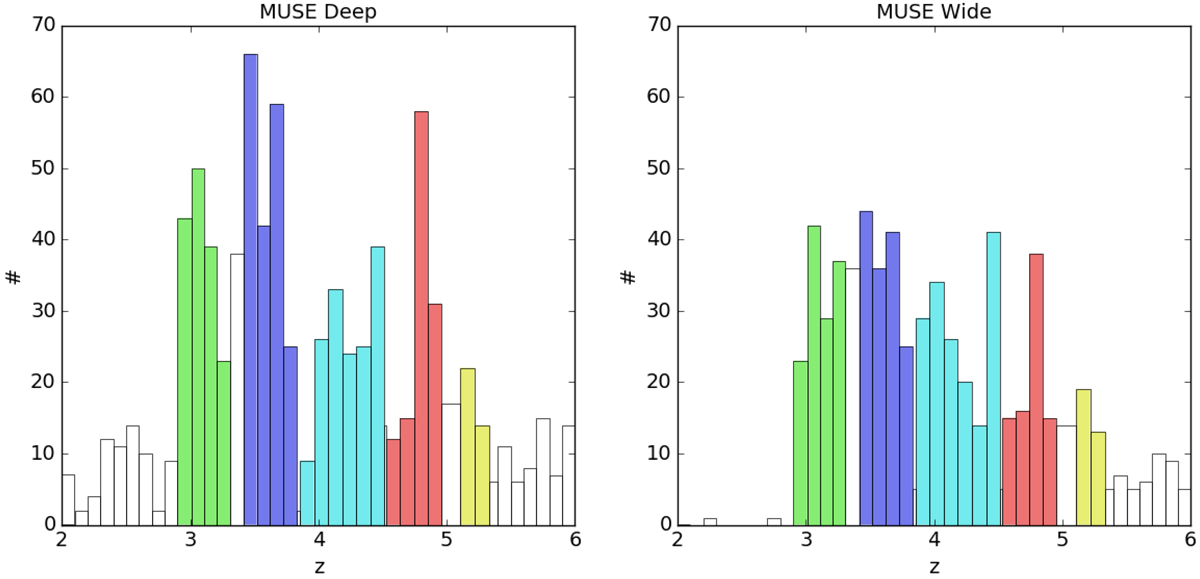
Number of galaxies vs. spectroscopic redshift based on our MUSE Deep (left) and MUSE wide (right) data sets. The sources highlighted in green (z1) and blue (z2) are those where the [S III] 9068.6 Å line falls in the Spitzer/IRAC 3.6 μm and in the 4.5 μm bands, respectively, and no other strong lines seem likely to be present in the other band. Sources highlighted in cyan (z3) are those where the Hα line is present in the 3.6 μm band and [S III] is in the 4.5 μm band. Sources highlighted in red (z4) and yellow (z5) are those where Hα falls in the 3.6 μm and the 4.5 μm bands, respectively, and no other strong lines are located in the other Spitzer/IRAC band. See Table 2 for the numbers of sources and Fig. 1 for the line location with respect to the IRAC filters.
Current usage metrics show cumulative count of Article Views (full-text article views including HTML views, PDF and ePub downloads, according to the available data) and Abstracts Views on Vision4Press platform.
Data correspond to usage on the plateform after 2015. The current usage metrics is available 48-96 hours after online publication and is updated daily on week days.
Initial download of the metrics may take a while.