Fig. A.1.
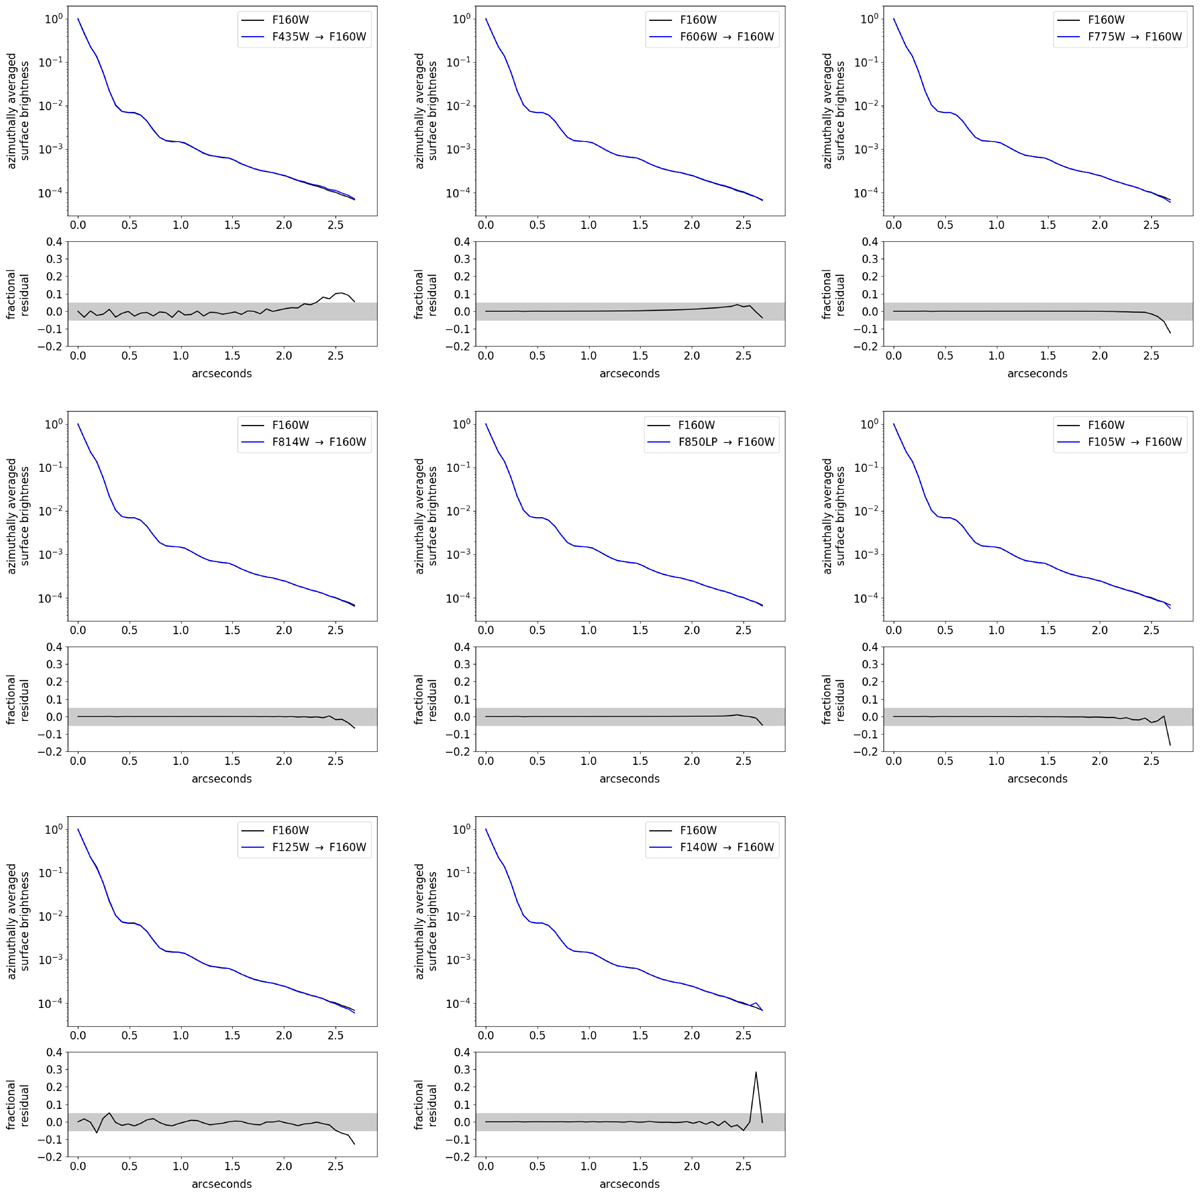
Upper sub-panels: comparison of the circularly-averaged radial profile in the F160W band (black curves) with similar radial profiles of the PSFs in the other bands convolved with the corresponding best-fit kernels (blue curves). Lower sub-panels: fractional residual between the profiles is shown. The gray region denotes ±5%.
Current usage metrics show cumulative count of Article Views (full-text article views including HTML views, PDF and ePub downloads, according to the available data) and Abstracts Views on Vision4Press platform.
Data correspond to usage on the plateform after 2015. The current usage metrics is available 48-96 hours after online publication and is updated daily on week days.
Initial download of the metrics may take a while.