Fig. 1.
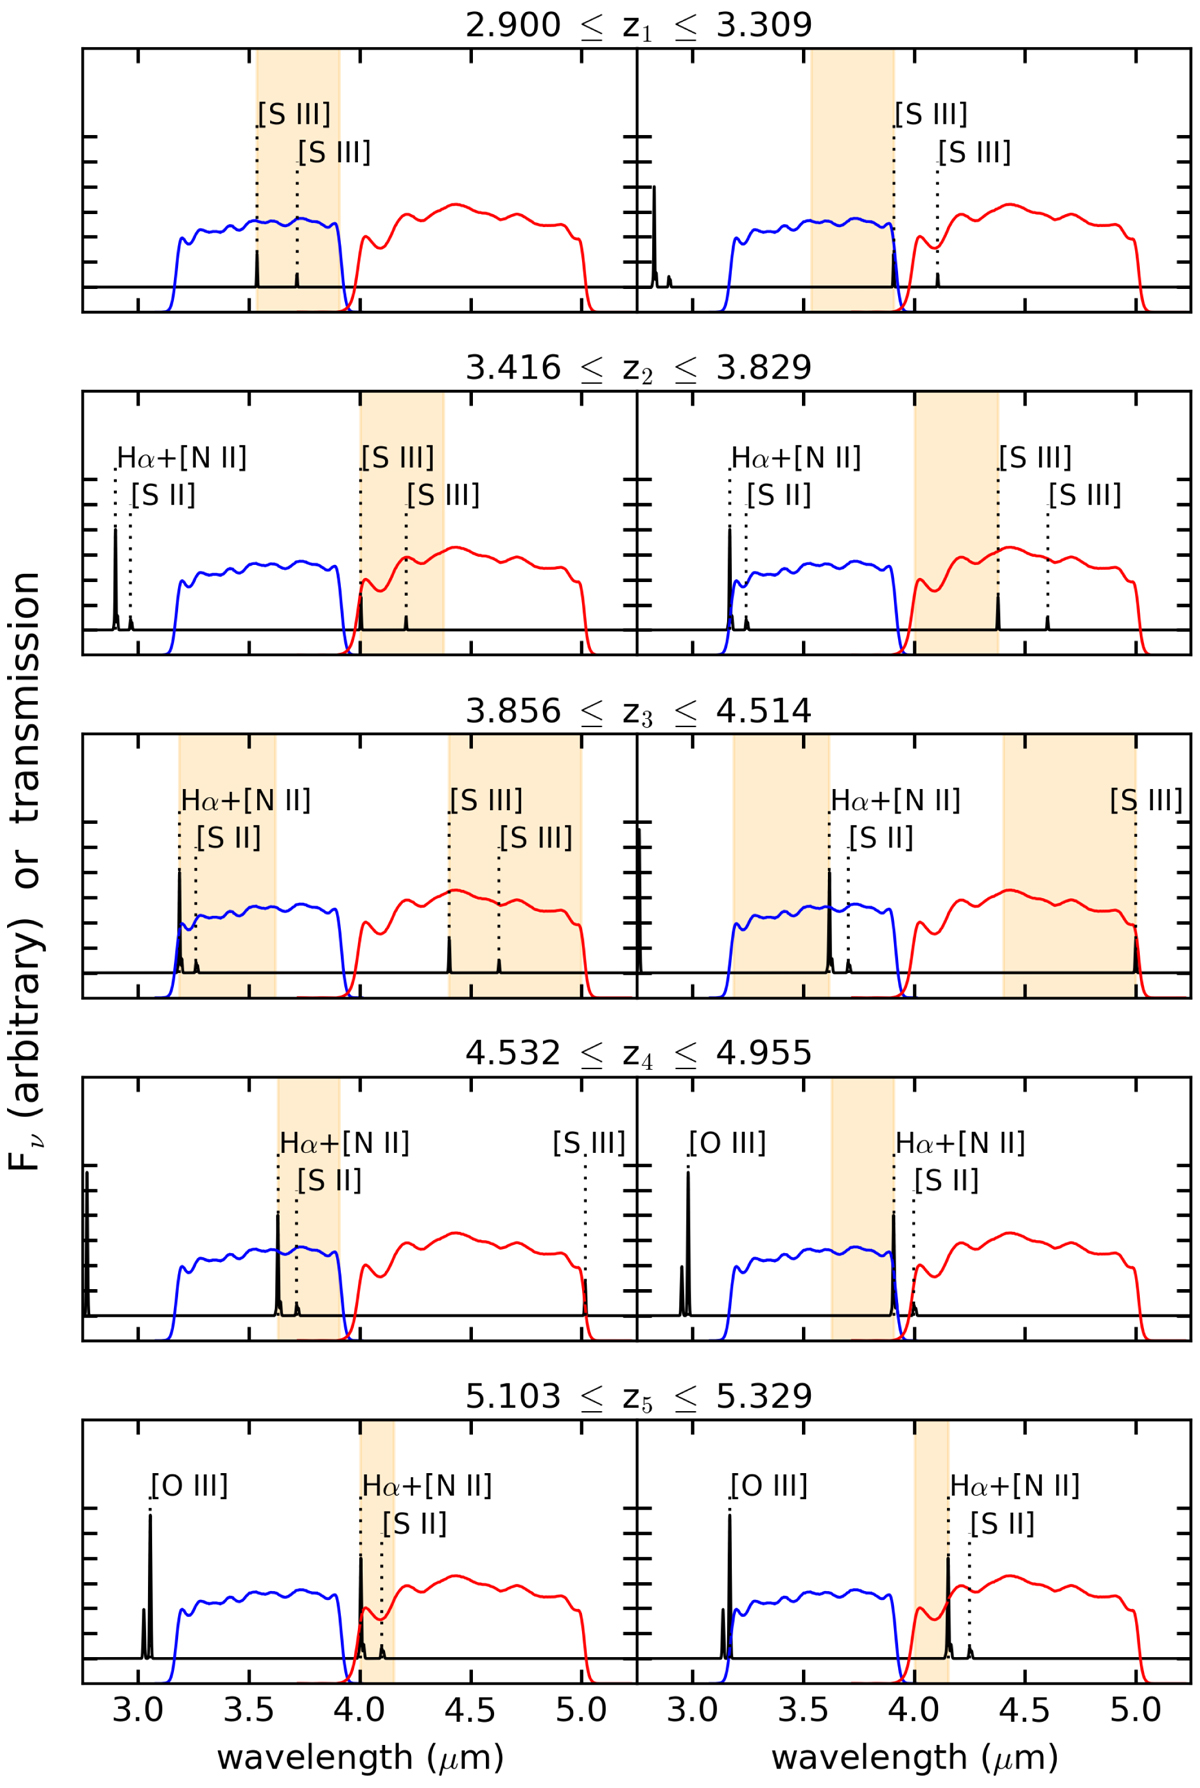
Illustration of where [S III] 9530.9 Å, Hα, and [O III] 5006.84 Å lie within the Spitzer/IRAC 3.6 μm and 4.5 μm bands at the low and high-redshift ends (left and right panels, respectively) of the redshift intervals selected for this analysis. The transmission curves of the 3.6 μm and 4.5 μm bands are shown as the blue and red lines, respectively. The orange color-shaded regions denote the wavelengths over which relevant lines (Hα and [S III] 9068.6 Å) lie within our defined redshift windows. z1 does not extend beyond z = 2.9 because MUSE sources at z < 2.9 are identified from spectral features other than Lyman α.
Current usage metrics show cumulative count of Article Views (full-text article views including HTML views, PDF and ePub downloads, according to the available data) and Abstracts Views on Vision4Press platform.
Data correspond to usage on the plateform after 2015. The current usage metrics is available 48-96 hours after online publication and is updated daily on week days.
Initial download of the metrics may take a while.