Fig. 7
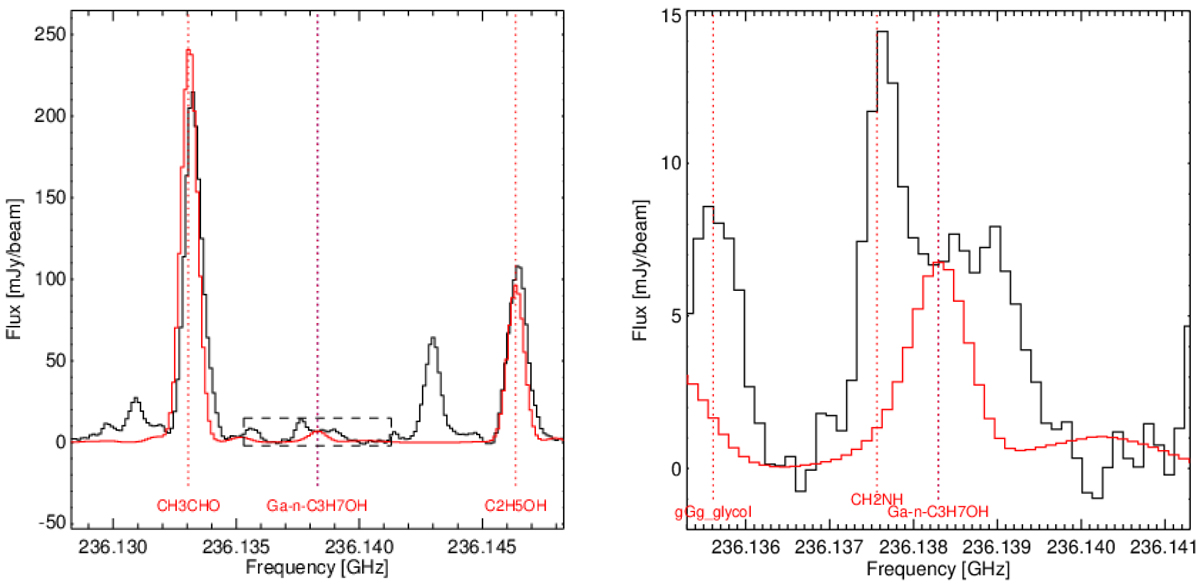
Extended (left panel) and zoomed-in (right panel) spectra around the 1-propanol transition. Observed spectrum (black) around the targeted 1-propanol transition at 236.138 GHz (purple dotted-line and black dashed-line box) towards the “full-beam” offset position located 0.5′′ away from the continuum peak of IRAS 16293-2422B. Synthetic spectrum of the LTE model is shown in red. The predicted 1-propanol transition shown here is for N(1-propanol) = 1.2 × 1015 cm−2 and Tex = 300 K (see text for more details). Red dotted-lines refer to the position of transitions of identified species detected above 5σ, with the associated species labelled below the spectrum.
Current usage metrics show cumulative count of Article Views (full-text article views including HTML views, PDF and ePub downloads, according to the available data) and Abstracts Views on Vision4Press platform.
Data correspond to usage on the plateform after 2015. The current usage metrics is available 48-96 hours after online publication and is updated daily on week days.
Initial download of the metrics may take a while.