Fig. 2
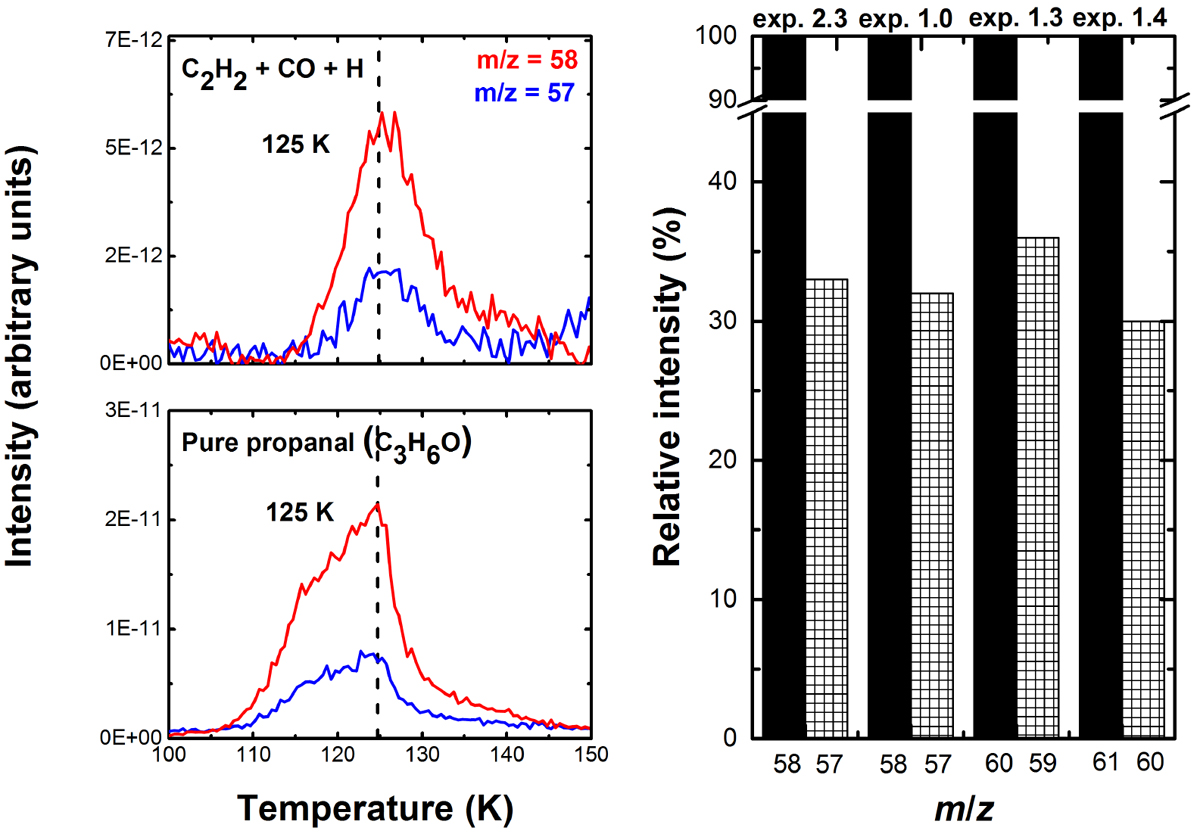
Left panel: TPD spectra of C2H2 + CO + H (top; exp. 1.0) and propanal (bottom; exp. 2.3) taken after deposition at 10 K. Right panel: QMS fragmentation pattern of two m/z values that are normalized to the QMS signal of the C3H6O+ ion (or the corresponding isotopologue) found in the propanal (exp. 2.3), C2H2 + CO + H (exp. 1.0), C2H2 + C18O + H (exp. 1.3), and C2H2 + 13C18O + H (exp. 1.4) experiments.
Current usage metrics show cumulative count of Article Views (full-text article views including HTML views, PDF and ePub downloads, according to the available data) and Abstracts Views on Vision4Press platform.
Data correspond to usage on the plateform after 2015. The current usage metrics is available 48-96 hours after online publication and is updated daily on week days.
Initial download of the metrics may take a while.