Fig. 1
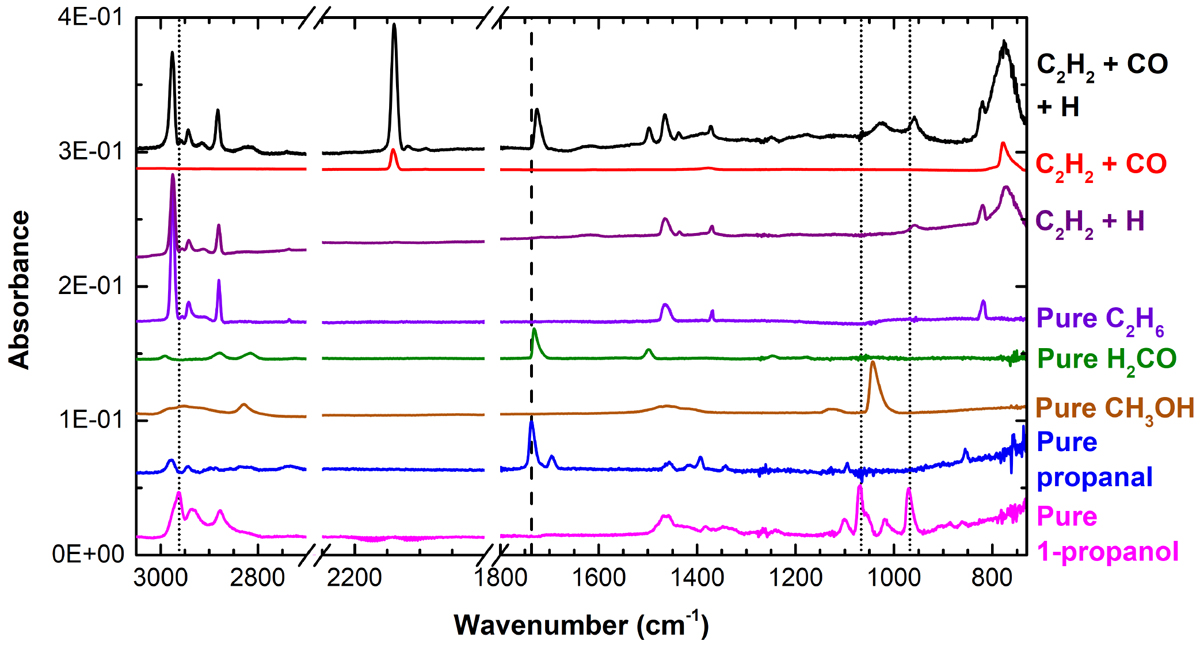
RAIR spectra obtained after the deposition of C2H2 + CO + H (exp. 1.0), C2H2 + H (exp. 1.2), 1-propanol (exp. 2.0), CH3OH (5 × 1015 cm−2), propanal (exp. 2.3), H2CO (5 × 1015 cm−2), C2H6 (5 × 1015 cm−2), and C2H2 + CO (exp. 1.1) on a 10 K surface. The spectrum of C2H6 is adapted from the work by Öberg et al. (2009). The dashed and dotted lines highlight the frequencies that correlate to the strongest features of propanal and 1-propanol, respectively. Spectra are scaled to highlight the IR features of interest, and are offset for clarity.
Current usage metrics show cumulative count of Article Views (full-text article views including HTML views, PDF and ePub downloads, according to the available data) and Abstracts Views on Vision4Press platform.
Data correspond to usage on the plateform after 2015. The current usage metrics is available 48-96 hours after online publication and is updated daily on week days.
Initial download of the metrics may take a while.