Fig. 6.
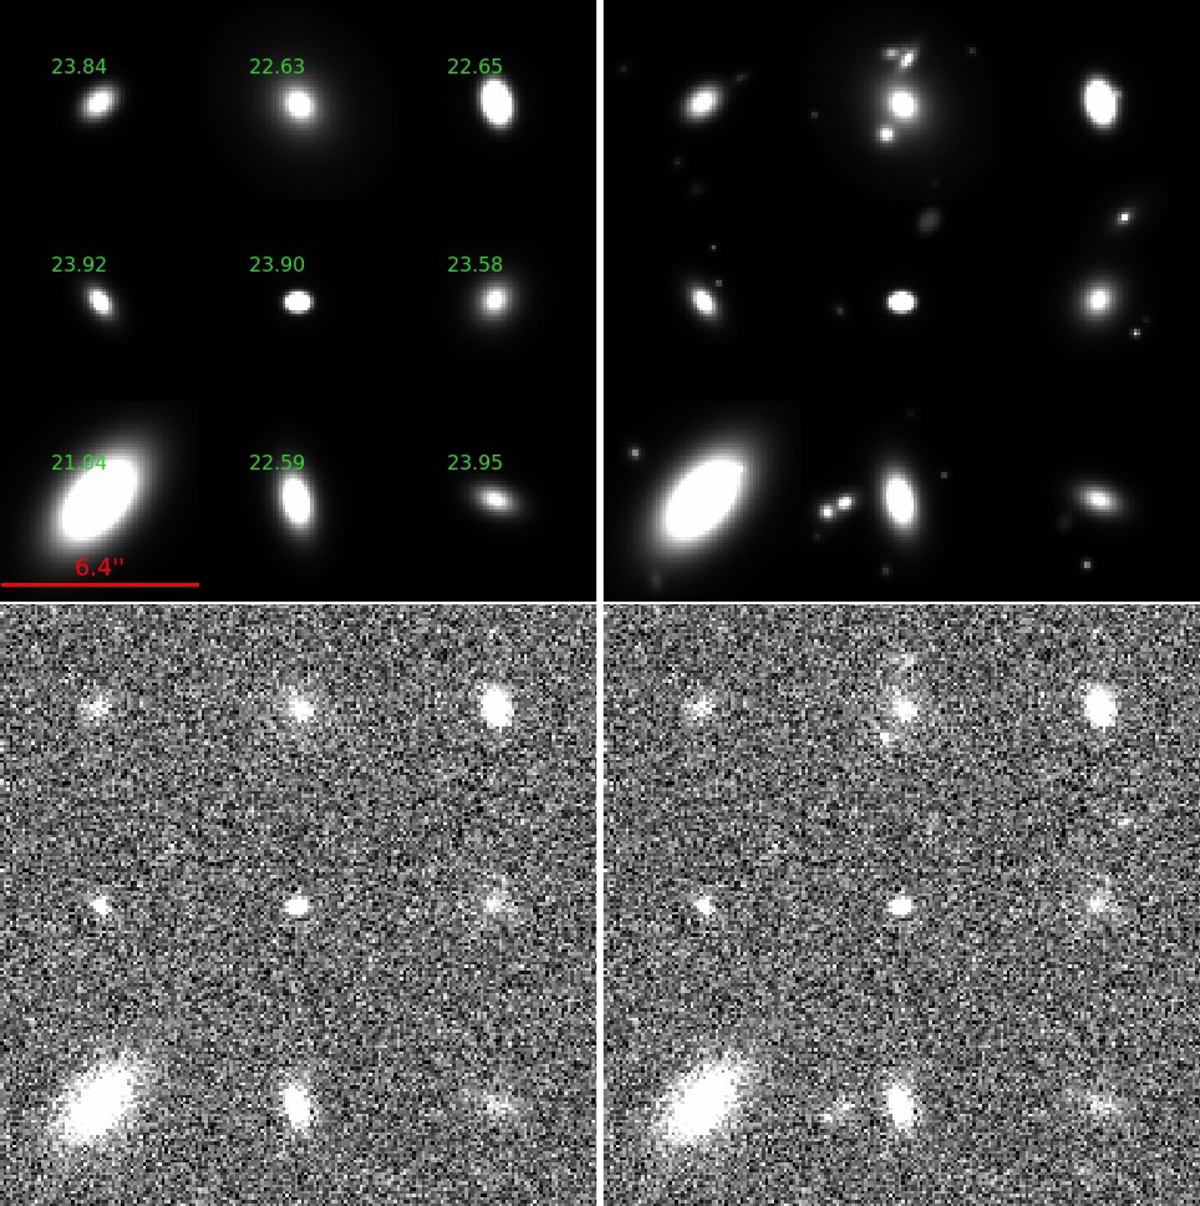
Image simulations, with bright galaxies on a grid (left), and with the faint galaxies down to magnitude 29 added, including clustering properties (right). The upper panel shows noiseless simulations and the bottom one simulations with realistic Gaussian noise. This sub-image presents nine tiles of ![]() each. The scale is given by the red line in the upper left panel. The numbers in the same panel correspond to the magnitudes of the bright galaxies. The two right panels are populated with an identical set of 30 faint galaxies.
each. The scale is given by the red line in the upper left panel. The numbers in the same panel correspond to the magnitudes of the bright galaxies. The two right panels are populated with an identical set of 30 faint galaxies.
Current usage metrics show cumulative count of Article Views (full-text article views including HTML views, PDF and ePub downloads, according to the available data) and Abstracts Views on Vision4Press platform.
Data correspond to usage on the plateform after 2015. The current usage metrics is available 48-96 hours after online publication and is updated daily on week days.
Initial download of the metrics may take a while.