Fig. 5.
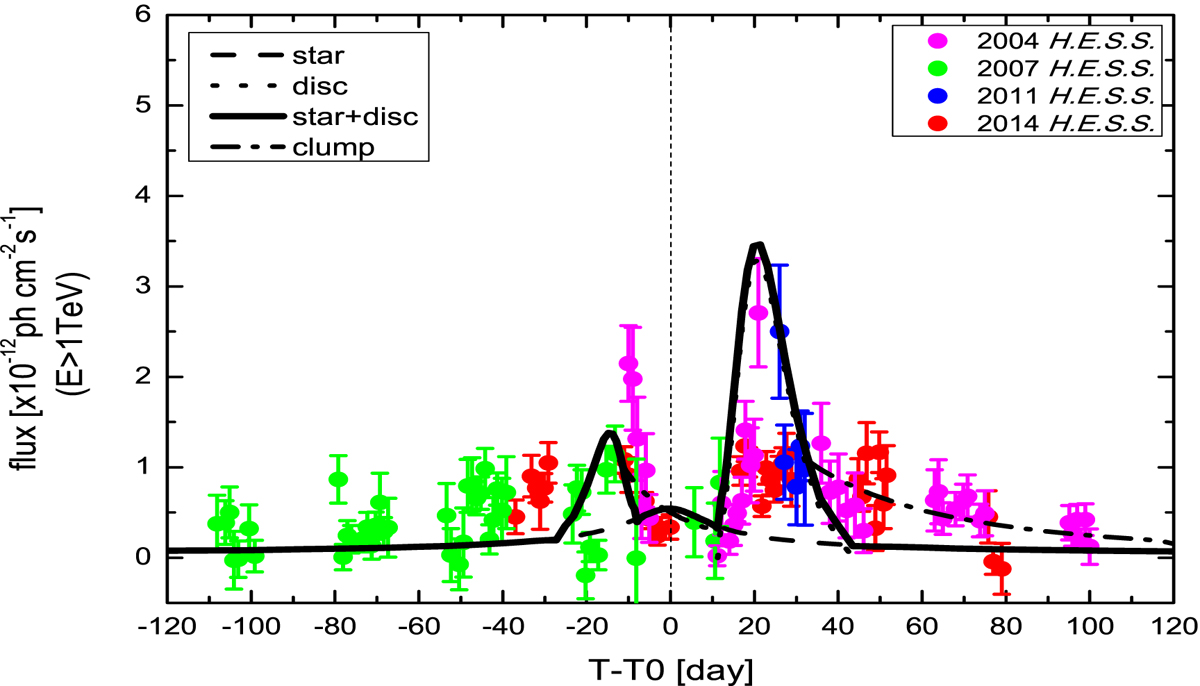
Integrated TeV light curves (E > 1 TeV) with comparisons of observations. The observational data are taken from the preliminary data reported by Romoli et al. (2017). The dashed and dotted lines correspond to the IC scattering with seed photons from the star and the shock heating of the disc. The solid line represents the total flux with both components. The dash-dotted line shows the effect of the disc matter clump at the shock front on TeV emissions.
Current usage metrics show cumulative count of Article Views (full-text article views including HTML views, PDF and ePub downloads, according to the available data) and Abstracts Views on Vision4Press platform.
Data correspond to usage on the plateform after 2015. The current usage metrics is available 48-96 hours after online publication and is updated daily on week days.
Initial download of the metrics may take a while.