Fig. 4.
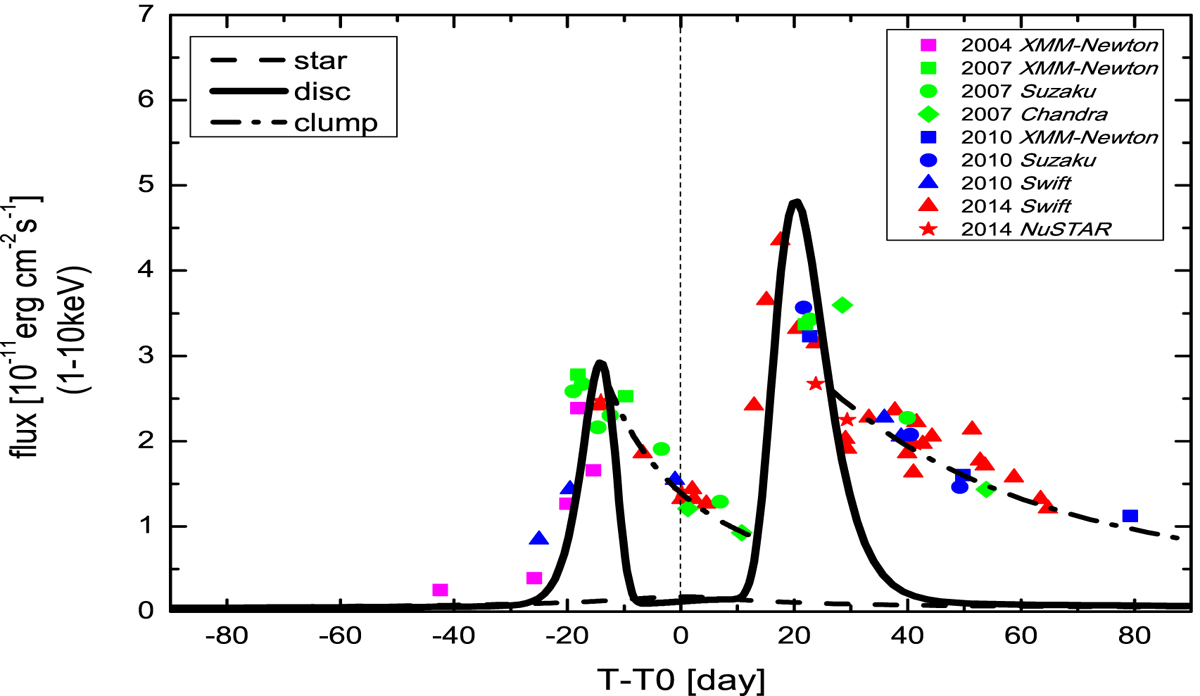
Integrated X-ray light curves (1–10 keV) with comparisons of observations. The observational data are taken from Chernyakova et al. (2015) without error bars. The dashed line corresponds to the case of synchrotron radiation without the stellar disc while the solid line takes into account the presence of the disc. The dash-dotted line shows the effect of the disc matter clump at the shock front on X-ray emissions.
Current usage metrics show cumulative count of Article Views (full-text article views including HTML views, PDF and ePub downloads, according to the available data) and Abstracts Views on Vision4Press platform.
Data correspond to usage on the plateform after 2015. The current usage metrics is available 48-96 hours after online publication and is updated daily on week days.
Initial download of the metrics may take a while.