Fig. 14
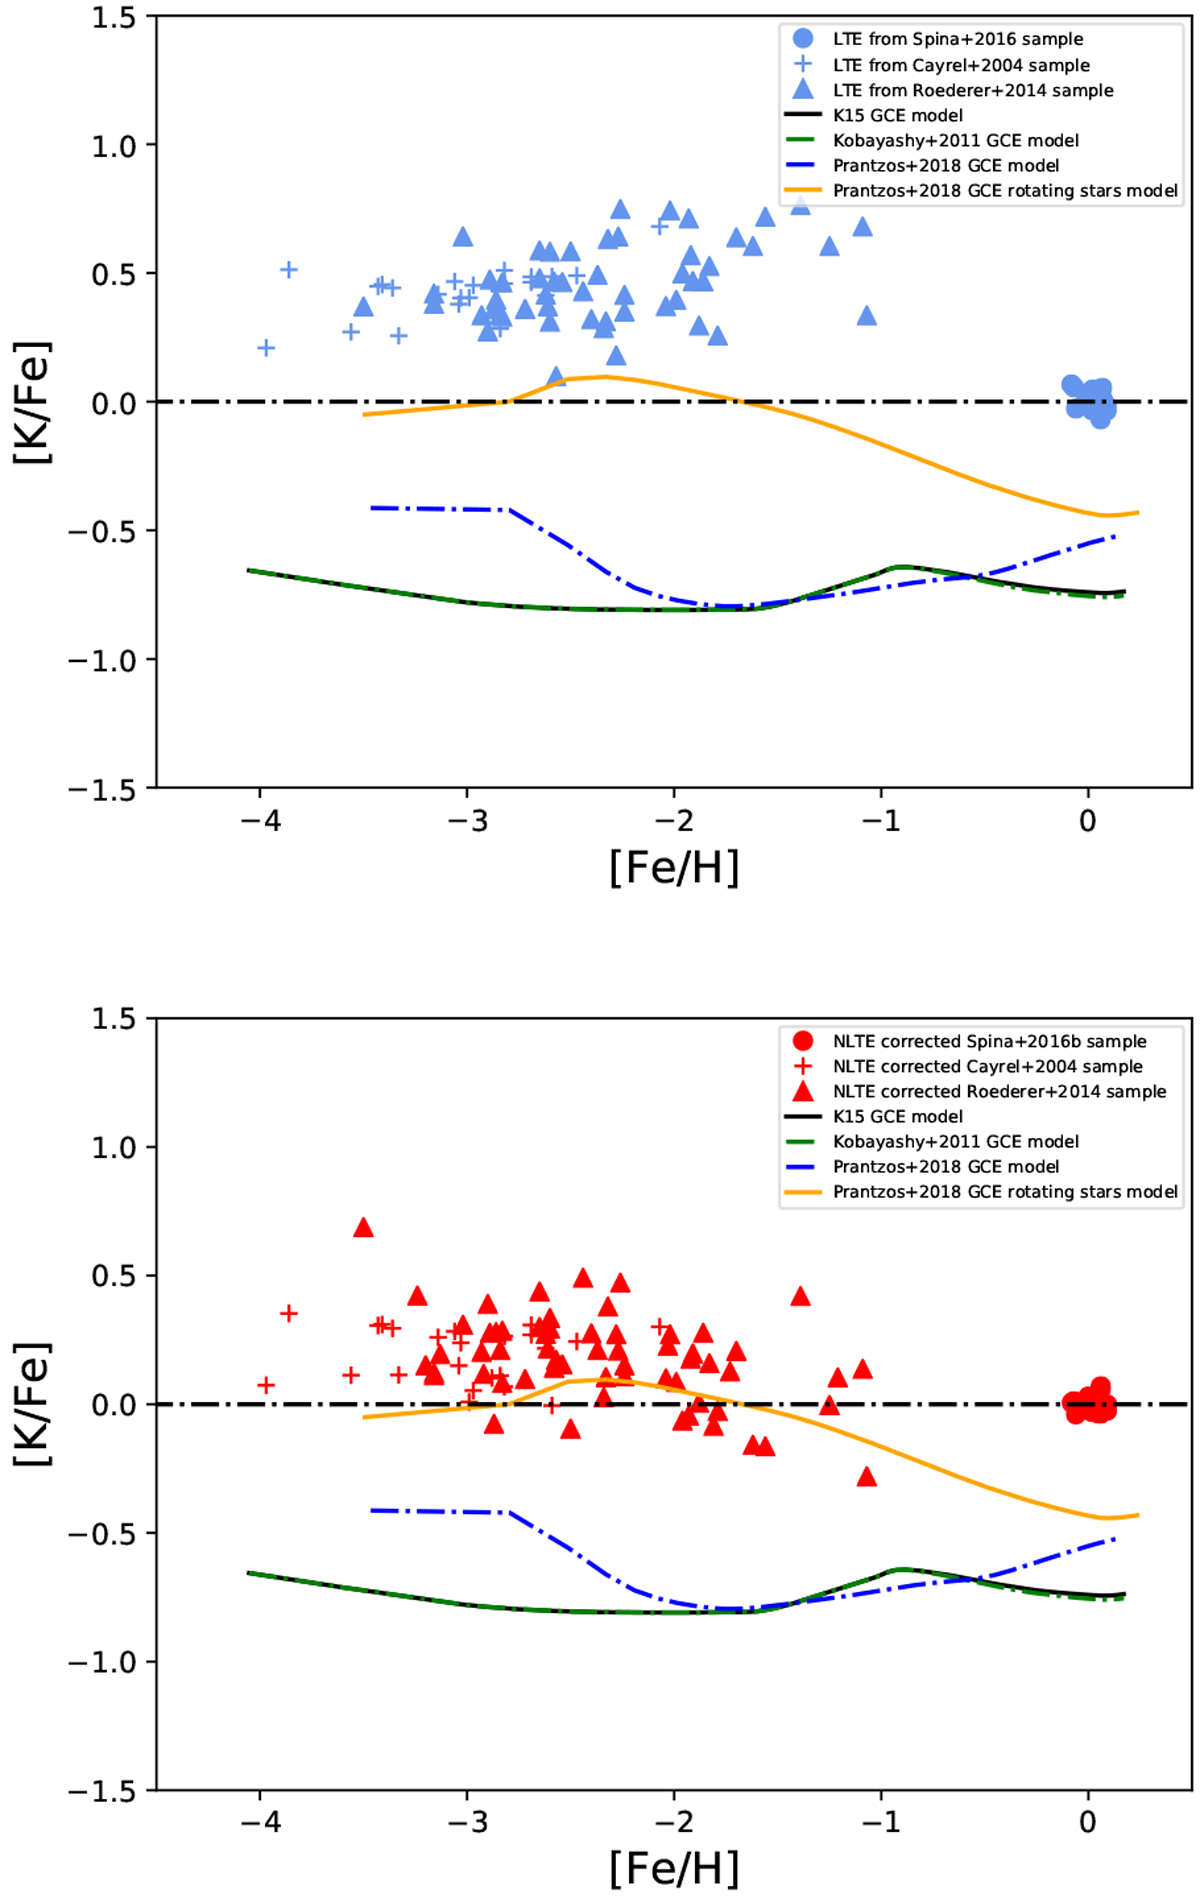
Top panel: LTE abundances calculated using MOOG and the EWs from Cayrel et al. (2004), Roederer et al. (2014), and Spina et al. (2016). Lower panel: non-LTE corrected abundances (from the LTE abundances in the upper panel). The LTE and non-LTE corrected abundances (in A(K)), are shown in Table A.1. In both panels we also show three different GCE models: in black the model from Kobayashi et al. (2011); in dashed blue and orange the models from Prantzos et al. (2018) without and with yields from massive rotating stars, respectively.
Current usage metrics show cumulative count of Article Views (full-text article views including HTML views, PDF and ePub downloads, according to the available data) and Abstracts Views on Vision4Press platform.
Data correspond to usage on the plateform after 2015. The current usage metrics is available 48-96 hours after online publication and is updated daily on week days.
Initial download of the metrics may take a while.