Fig. 7.
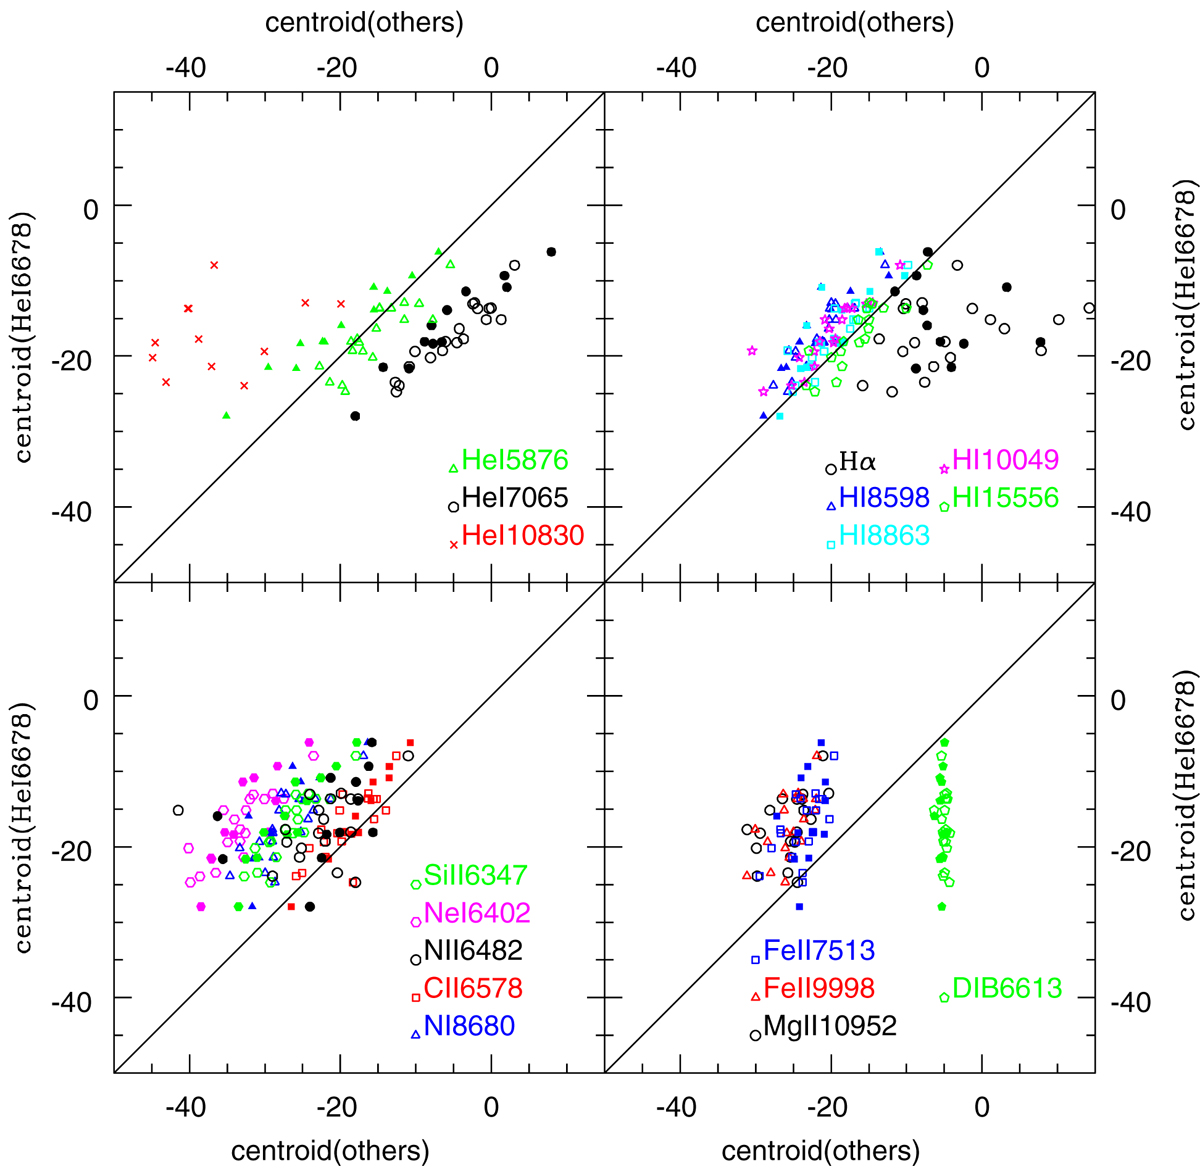
Comparisons between the centroid of He I λ 6678 Å and the centroids of other lines detected in the spectrum of Schulte 12 (He I lines on top left, H I lines on top right, and metallic absorption and emission lines on bottom left and right, respectively). Filled symbols correspond to Hermes data, open symbols and crosses to Carmenes data; the diagonal yields the one-to-one correlation. For comparison, the case of a DIB is added to the last panel.
Current usage metrics show cumulative count of Article Views (full-text article views including HTML views, PDF and ePub downloads, according to the available data) and Abstracts Views on Vision4Press platform.
Data correspond to usage on the plateform after 2015. The current usage metrics is available 48-96 hours after online publication and is updated daily on week days.
Initial download of the metrics may take a while.