Fig. 6.
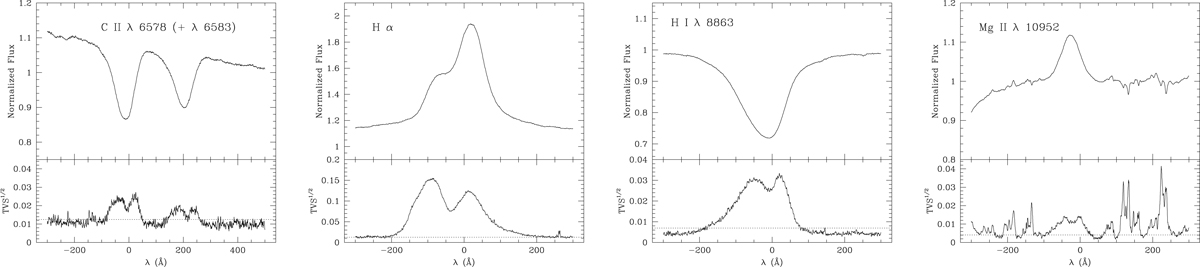
Mean spectrum and temporal variance spectrum for various lines in the spectrum of Schulte 12. The dotted lines in the TVS1/2 panels correspond to the 1% significance level of variability evaluated accounting for the S/N of the data. On the sides of the Mg II line, significant narrow variabilities are due to the imperfect correction of the telluric lines.
Current usage metrics show cumulative count of Article Views (full-text article views including HTML views, PDF and ePub downloads, according to the available data) and Abstracts Views on Vision4Press platform.
Data correspond to usage on the plateform after 2015. The current usage metrics is available 48-96 hours after online publication and is updated daily on week days.
Initial download of the metrics may take a while.