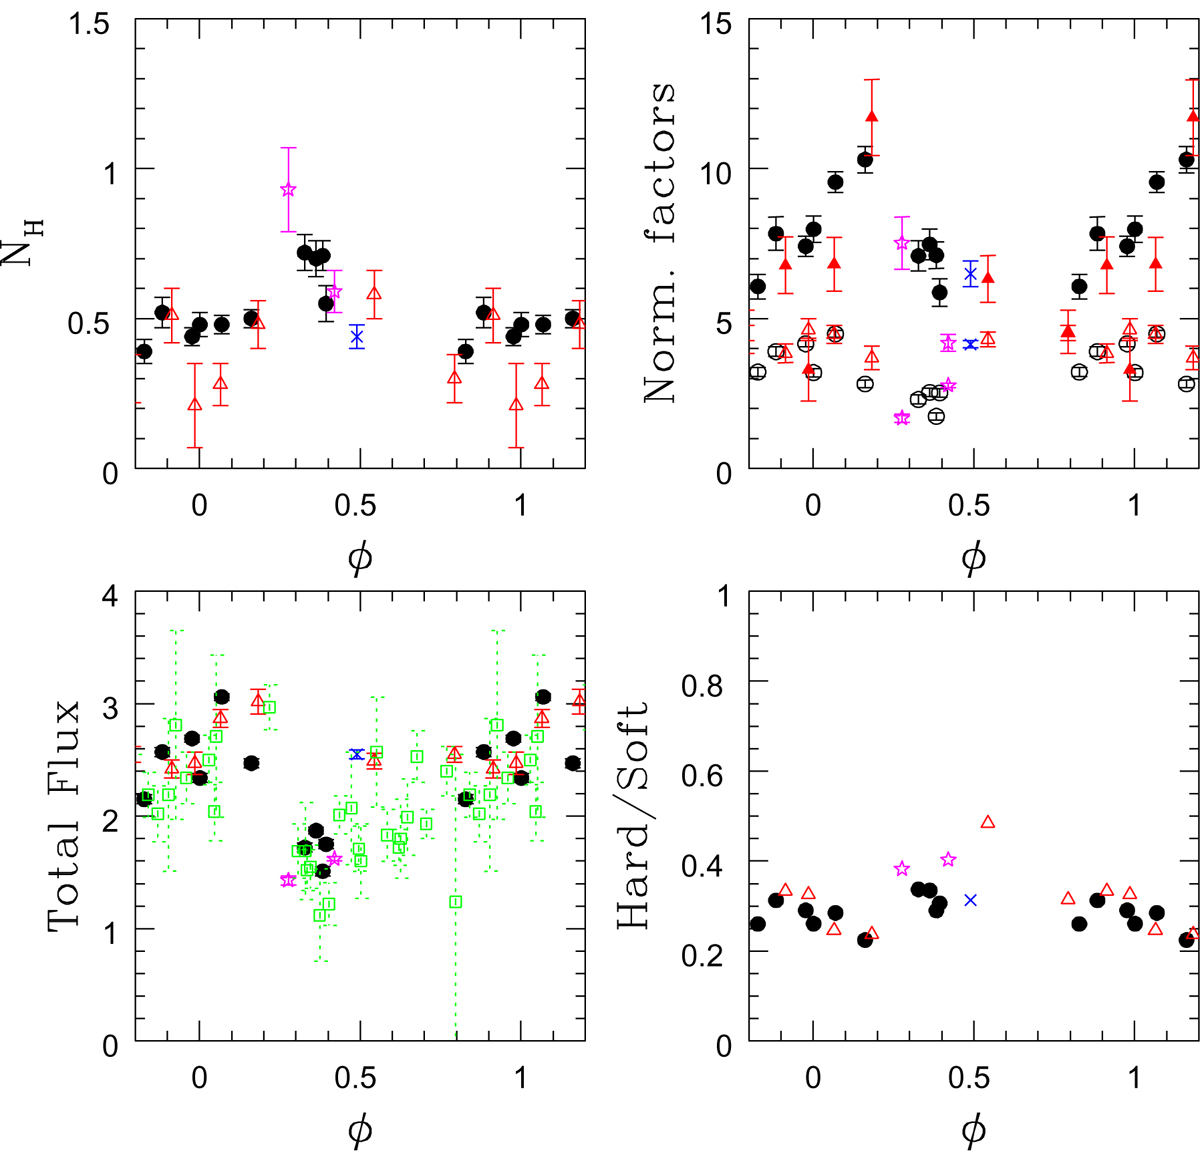
Fig. 3.

Results of the spectral fits: circumstellar absorption (top left), normalization factors (top right – the norm1 (resp. norm2) values appear in the upper (resp. lower) part, with filled (resp. empty) circles for XMM-Newton data), observed flux (bottom left), and ratio of unabsorbed hard and soft fluxes (bottom right). The results for XMM-Newton data are shown as black circles except for the stray light-contaminated cases displayed as red triangles; magenta stars indicate Chandra data; blue crosses the Suzaku observation; and Swift data are shown as empty green squares (shown for fluxes only). The phase folding is done as in Fig. 2.
Current usage metrics show cumulative count of Article Views (full-text article views including HTML views, PDF and ePub downloads, according to the available data) and Abstracts Views on Vision4Press platform.
Data correspond to usage on the plateform after 2015. The current usage metrics is available 48-96 hours after online publication and is updated daily on week days.
Initial download of the metrics may take a while.


