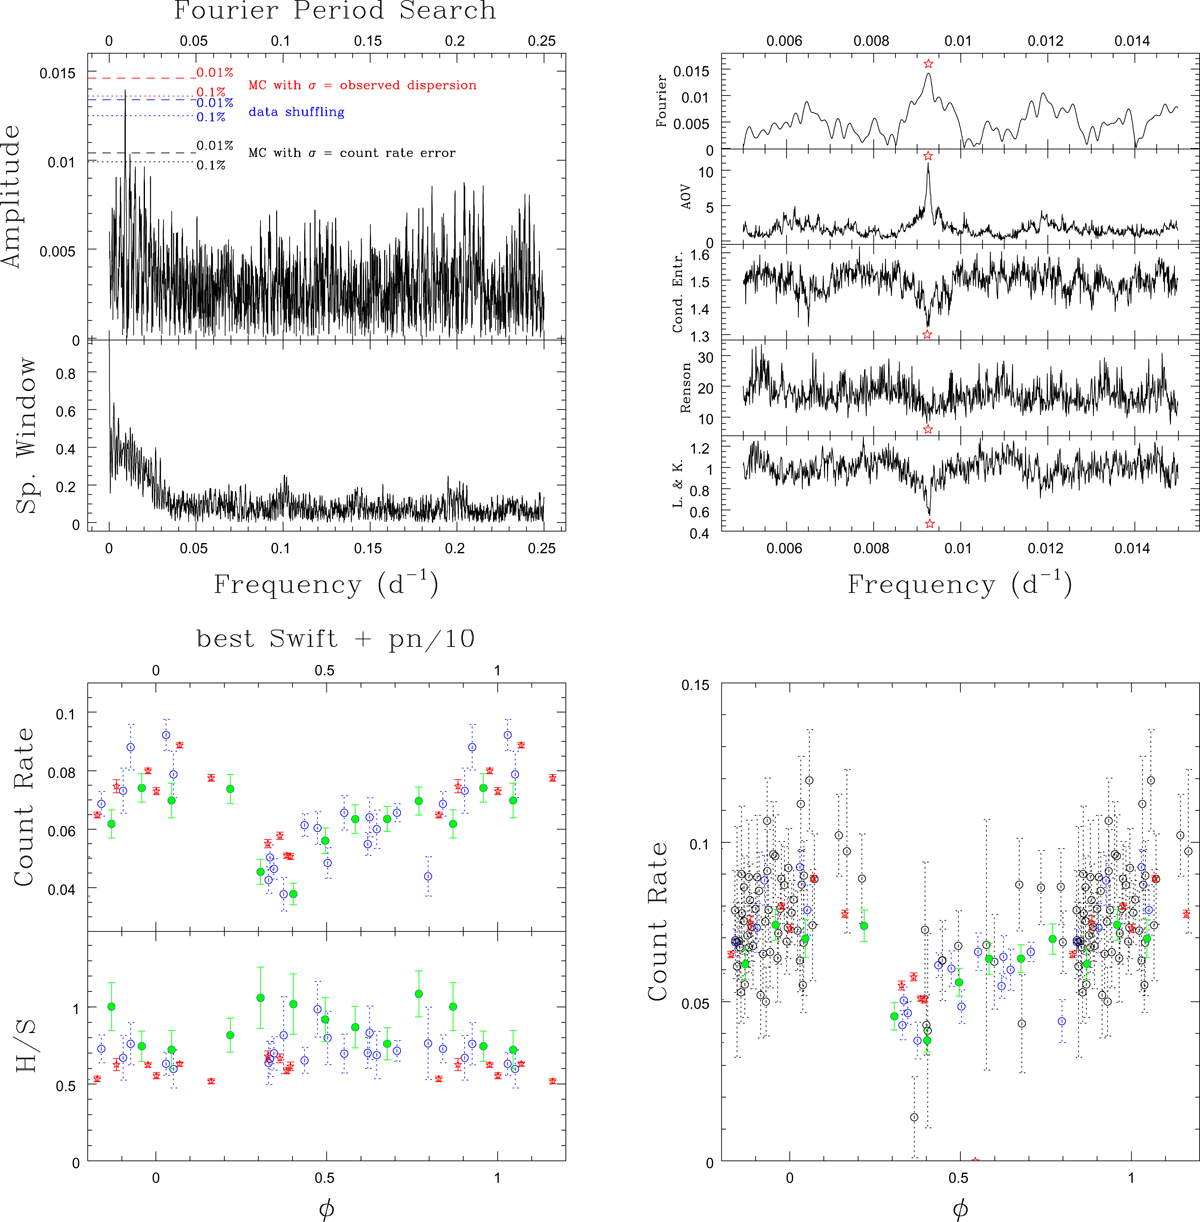
Fig. 2.

Top left: Fourier periodogram calculated from the Swift light curve, showing a clear peak at low frequencies. Significance levels of 0.1% and 0.01%, derived from tests (see text for details), are shown as dotted and dashed lines, respectively. Top right: comparison of period search results on the light curve composed of Swift data and scaled EPIC-pn data with different methods: the same peak (maxima for Fourier and AOV, minima for Renson, Lafler & Kinman, and conditional entropy) is detected in all cases and marked by a star. Bottom left: phase-folded X-ray light curve, using P = 107.99 d and T0 = 2 458 288.654. Our 2018 Swift monitoring campaign of Schulte 12 is shown in green and other high-quality (error on count rate < 0.008 cts s−1) Swift points in blue; EPIC-pn count rates divided by ten are shown as red stars; we note the good agreement between all data. Bottom right: same as previous, but with the lower-quality Swift data shown in dotted black.
Current usage metrics show cumulative count of Article Views (full-text article views including HTML views, PDF and ePub downloads, according to the available data) and Abstracts Views on Vision4Press platform.
Data correspond to usage on the plateform after 2015. The current usage metrics is available 48-96 hours after online publication and is updated daily on week days.
Initial download of the metrics may take a while.


