Free Access
Fig. A.3.
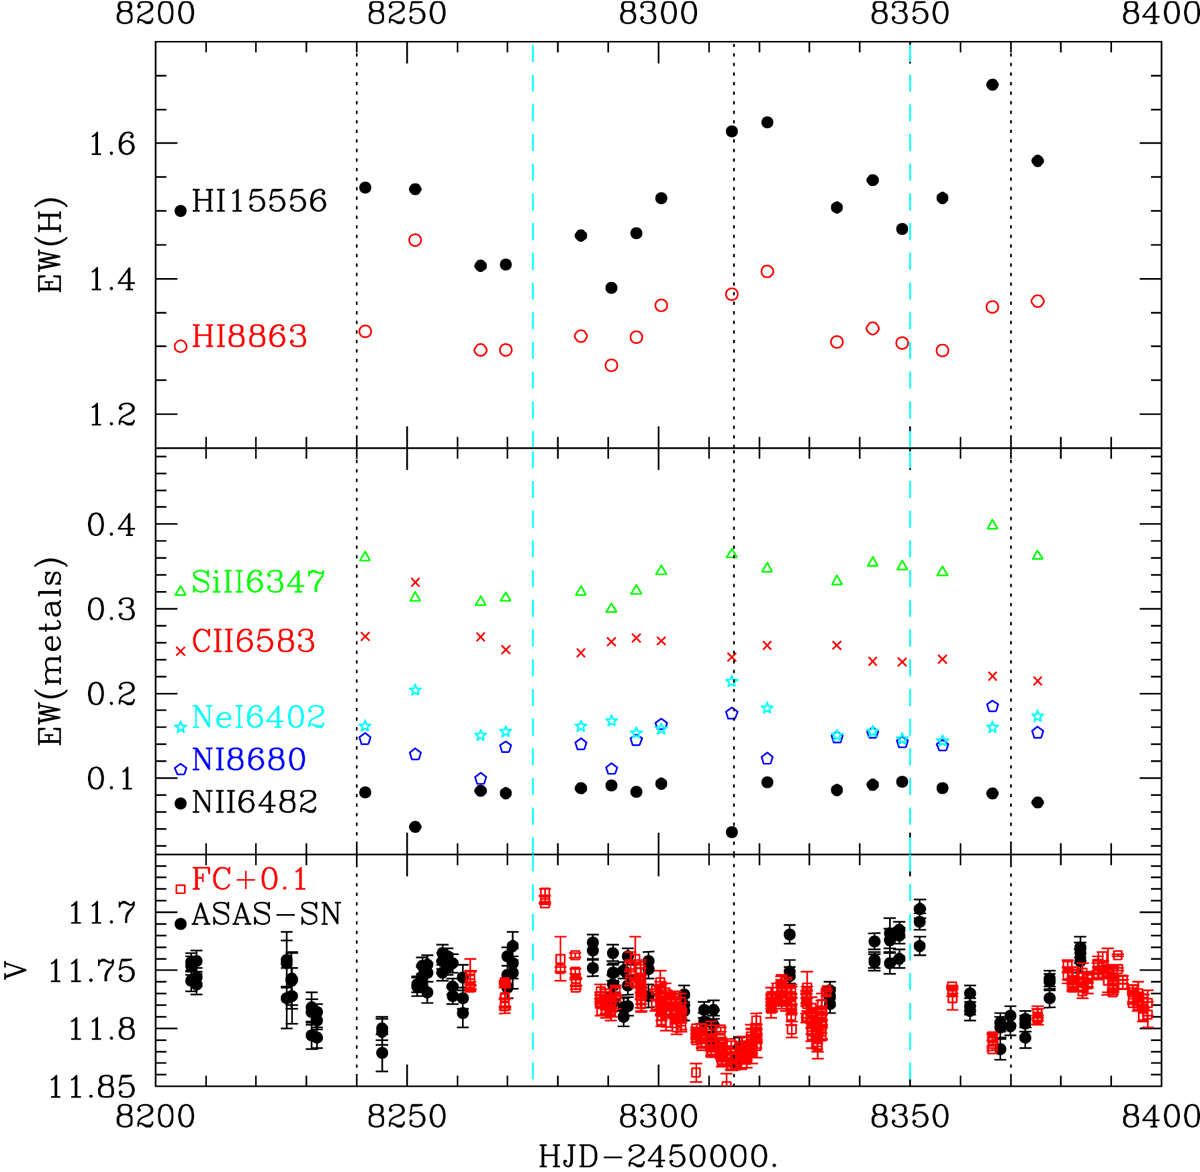
Variation of the line strengths and the photometry in 2018. Formal errors on EWs are similar to the symbol size. The dashed cyan and dotted black vertical lines indicate times of maximum and minimum brightness, respectively.
Current usage metrics show cumulative count of Article Views (full-text article views including HTML views, PDF and ePub downloads, according to the available data) and Abstracts Views on Vision4Press platform.
Data correspond to usage on the plateform after 2015. The current usage metrics is available 48-96 hours after online publication and is updated daily on week days.
Initial download of the metrics may take a while.