Fig. A.2.
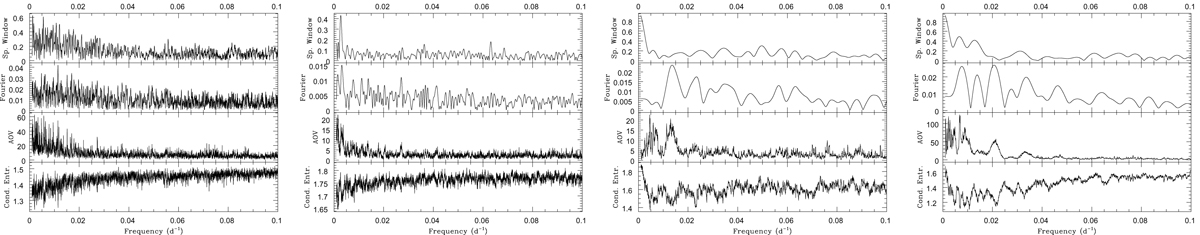
Results from period searches on the visible light curves. From left to right: results for OMC data, ASAS-SN data (all runs and last run only), and our own photometry. In each panel, from top to bottom: periodogram resulting from the Fourier method (with its spectral window), the AOV method, and the conditional entropy method (see text for details).
Current usage metrics show cumulative count of Article Views (full-text article views including HTML views, PDF and ePub downloads, according to the available data) and Abstracts Views on Vision4Press platform.
Data correspond to usage on the plateform after 2015. The current usage metrics is available 48-96 hours after online publication and is updated daily on week days.
Initial download of the metrics may take a while.