Fig. 11.
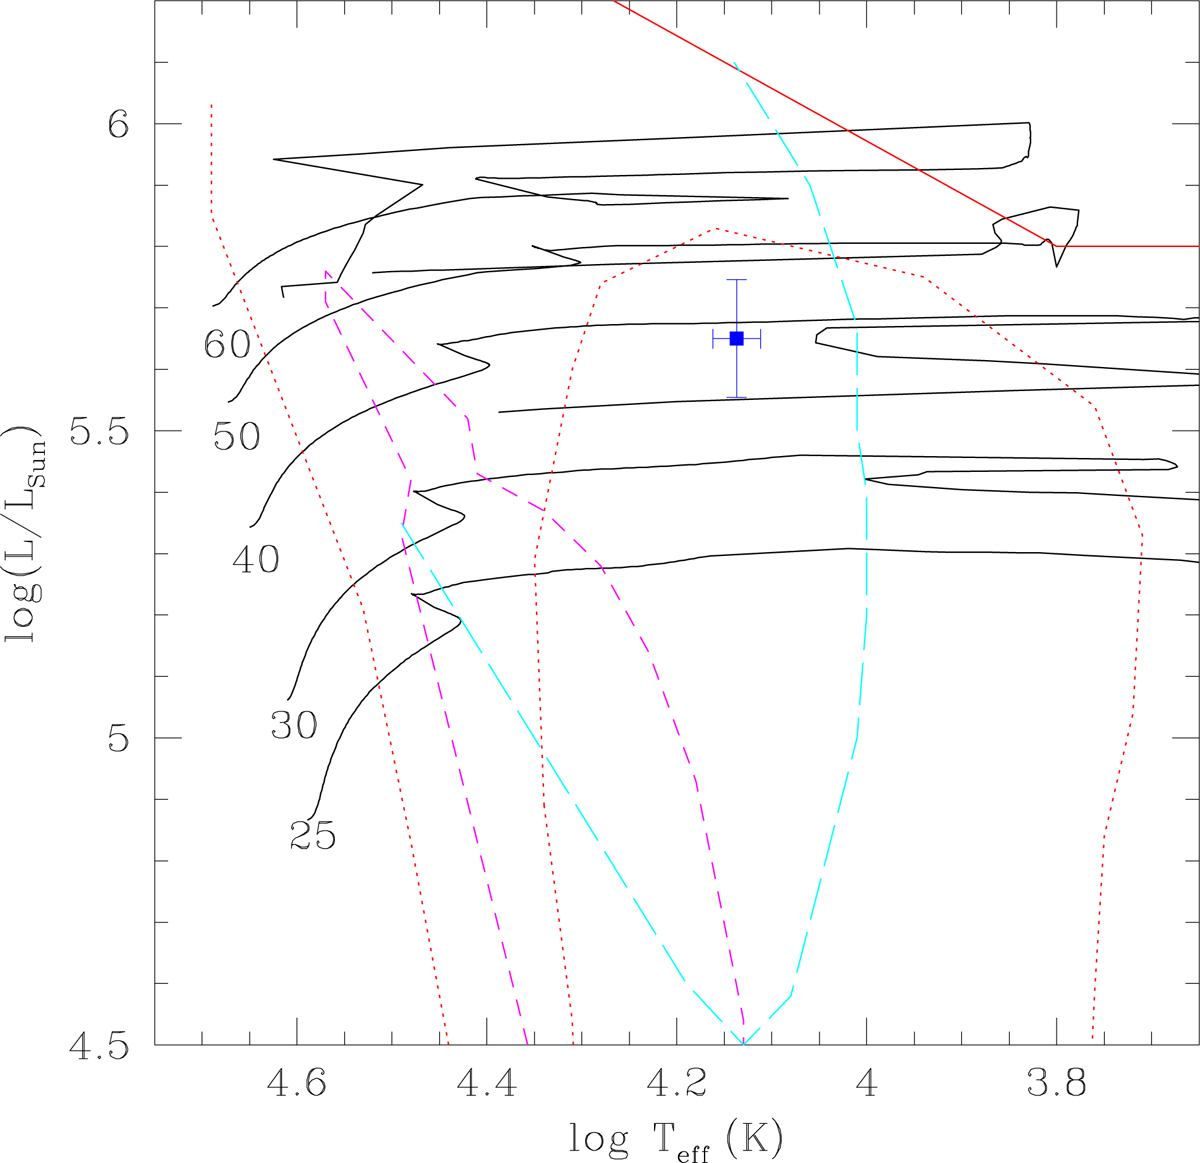
Revised position of Schulte 12 in the Hertzsprung-Russell diagram adopting the distance corresponding to the Gaia-DR2 parallax. The evolutionary tracks are taken from Ekström et al. (2012) for solar metallicity and no rotation. The continuous red line corresponds to the empirical Humphreys–Davidson limit (Humphreys & Davidson 1994). Various instability boundaries are shown according to Saio (2011). The dotted red curve indicates the instability boundary of low-order radial and non-radial p-mode oscillations. The short-dashed magenta contour indicates the region where non-radial g-modes with ℓ ≤ 2 are excited by the iron opacity bump. Finally, the cyan long-dashed contour indicates the region where oscillatory convection modes with ℓ ≤ 2 are excited (Saio 2011).
Current usage metrics show cumulative count of Article Views (full-text article views including HTML views, PDF and ePub downloads, according to the available data) and Abstracts Views on Vision4Press platform.
Data correspond to usage on the plateform after 2015. The current usage metrics is available 48-96 hours after online publication and is updated daily on week days.
Initial download of the metrics may take a while.