Fig. 5.
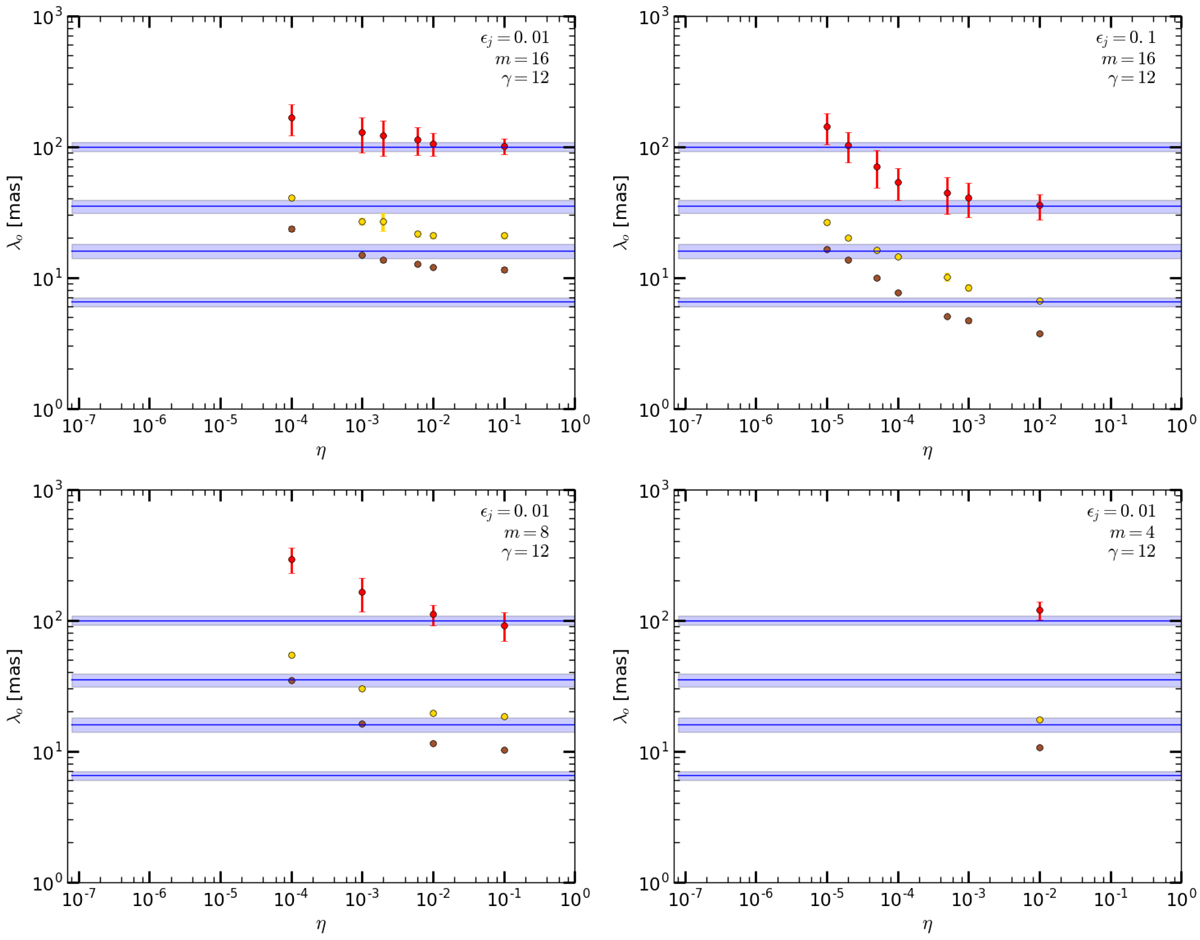
Observed wavelengths and their errors (blue lines and shades) compared to the wavelengths of different instability modes (symbols) obtained from the linear stability analysis. The color scheme used for representing the calculated wavelengths is the same as the one used in Fig. 4. The x-axis represents the density ratio and the y-axis the corresponding observed wavelength. Upper left panel: results for a shear layer of steepness m = 16 and jet internal energy of 0.01. Upper right panel: results for a shear layer of steepness m = 16 and jet internal energy of 0.1. Lower left panel: results for a shear layer of steepness m = 8 and jet internal energy of 0.01. Lower right panel: results for a shear layer of steepness m = 4 and jet internal energy of 0.01.
Current usage metrics show cumulative count of Article Views (full-text article views including HTML views, PDF and ePub downloads, according to the available data) and Abstracts Views on Vision4Press platform.
Data correspond to usage on the plateform after 2015. The current usage metrics is available 48-96 hours after online publication and is updated daily on week days.
Initial download of the metrics may take a while.