Fig. 1
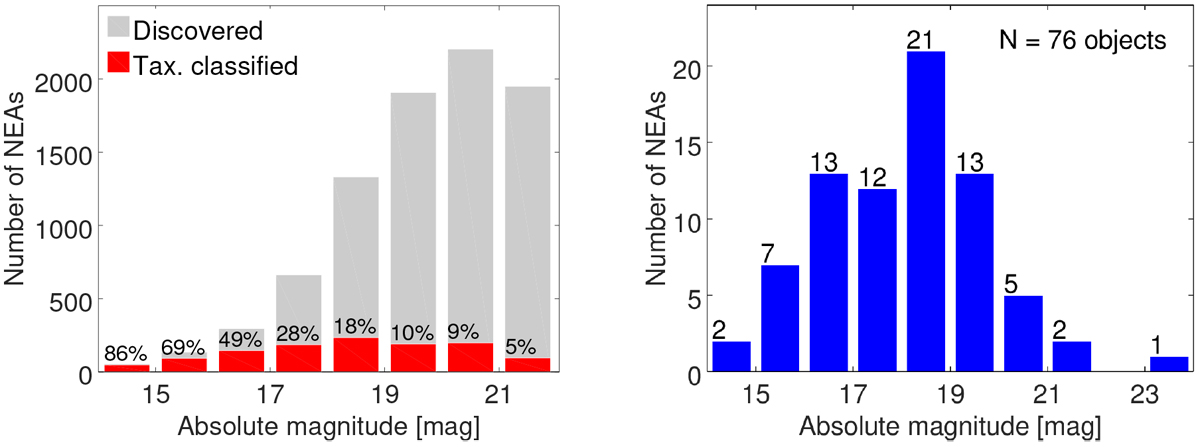
Left: number of NEAs as a function of their absolute magnitudes. The discovered objects are shown with gray, while those with a taxonomic classification are shown with red (including this work). The number above each bar represents the percentage of asteroids with taxonomic classification with respect to the discovered ones. Right: absolute magnitude distribution of NEAs observed with INT/IDS instrument.
Current usage metrics show cumulative count of Article Views (full-text article views including HTML views, PDF and ePub downloads, according to the available data) and Abstracts Views on Vision4Press platform.
Data correspond to usage on the plateform after 2015. The current usage metrics is available 48-96 hours after online publication and is updated daily on week days.
Initial download of the metrics may take a while.