Fig. 8
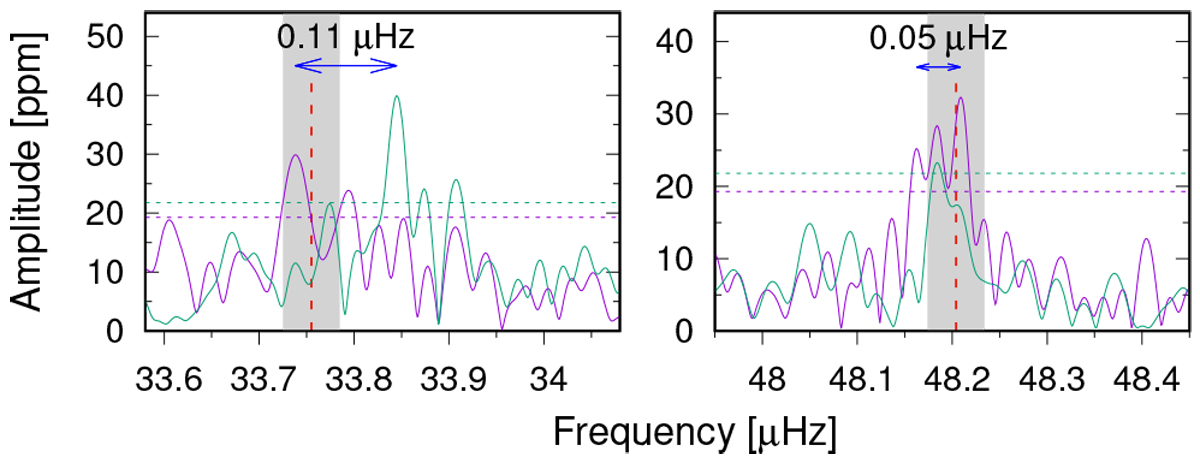
Fourier transforms of two halves (~700 days) of KIC 5807616 data around the F2 (33.839 μHz) and F1 (48.182 μHz) frequenciesfrom Charpinet et al. (2011). The green line shows the FT of the Q 5–Q 10 light curves, and the pink line plots the FT of the Q 11–Q 17 light curves. The detection thresholds are plotted with dashed horizontal lines in colors corresponding to FT colors. The gray vertical stripes indicate the ±0.03 μHz frequency scatter region, and the red vertical lines denote the positions of the F2 and F1 signals found by Charpinet et al. (2011) (see the text for details).
Current usage metrics show cumulative count of Article Views (full-text article views including HTML views, PDF and ePub downloads, according to the available data) and Abstracts Views on Vision4Press platform.
Data correspond to usage on the plateform after 2015. The current usage metrics is available 48-96 hours after online publication and is updated daily on week days.
Initial download of the metrics may take a while.