Fig. 7
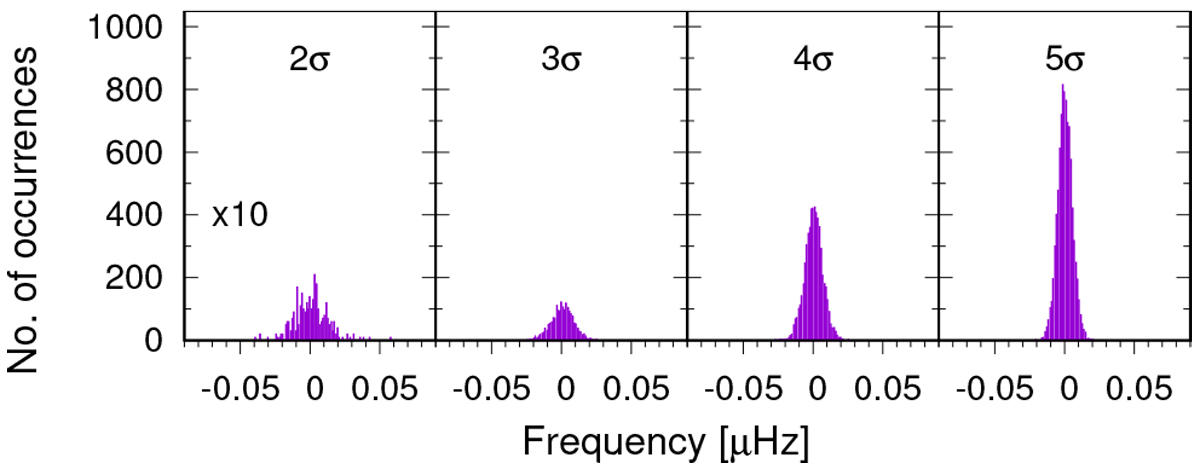
Signal frequency distribution in FTs of the 200-day light curves, including the constant-frequency sinusoidal component. The amplitudes of the sinusoidal components in the light curves were generated at two, three, four, and five times the σ levels (i.e., the average FT noise value of ~13.6 ppm). Only signals with amplitudes above the 4σ FT detection threshold were taken into account. For high simulated amplitudes, the corresponding FT signal frequencies are confined in a narrow ±0.02 μHz range (right panel). The range increases up to ±0.03 μHz for the low-amplitude signals. Left panel: enlarged ten times to account for the small number of signal detections above 4 σ.
Current usage metrics show cumulative count of Article Views (full-text article views including HTML views, PDF and ePub downloads, according to the available data) and Abstracts Views on Vision4Press platform.
Data correspond to usage on the plateform after 2015. The current usage metrics is available 48-96 hours after online publication and is updated daily on week days.
Initial download of the metrics may take a while.