Fig. 5
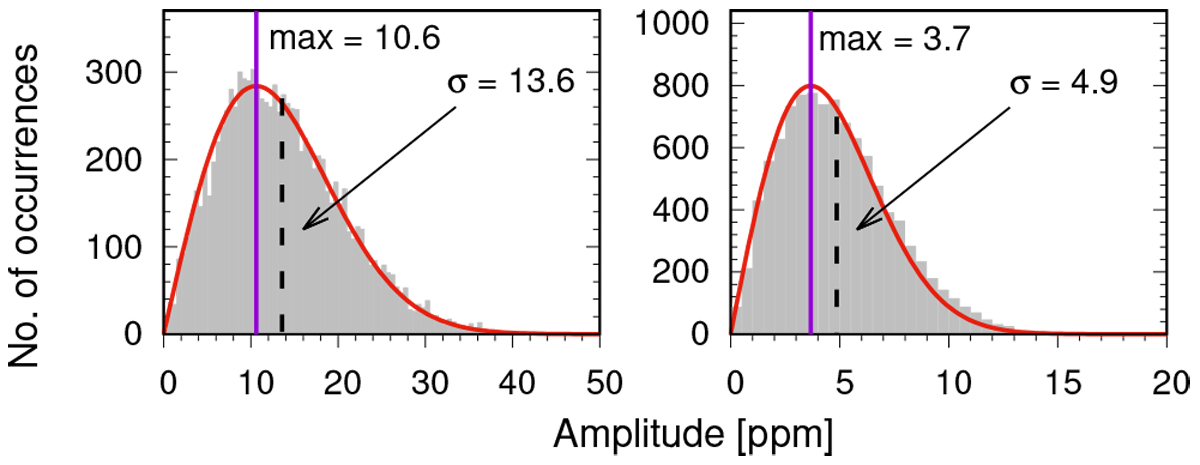
Distributions of the noise amplitude in FTs of 200-day (left) and 1440-day (right) light curves. The simulated light-curve noise was set at the levels corresponding to ~13.6 ppm of the average FT noise (σ) for the 200-day and ~4.9 ppm for the 1440-day data sets. The FSB width was set to 0 μHz. The verticalblue lines at 10.6 and 3.7 ppm denote histogram maxima, while the average FT noise is indicated by the dashed lines.
Current usage metrics show cumulative count of Article Views (full-text article views including HTML views, PDF and ePub downloads, according to the available data) and Abstracts Views on Vision4Press platform.
Data correspond to usage on the plateform after 2015. The current usage metrics is available 48-96 hours after online publication and is updated daily on week days.
Initial download of the metrics may take a while.