Fig. 3
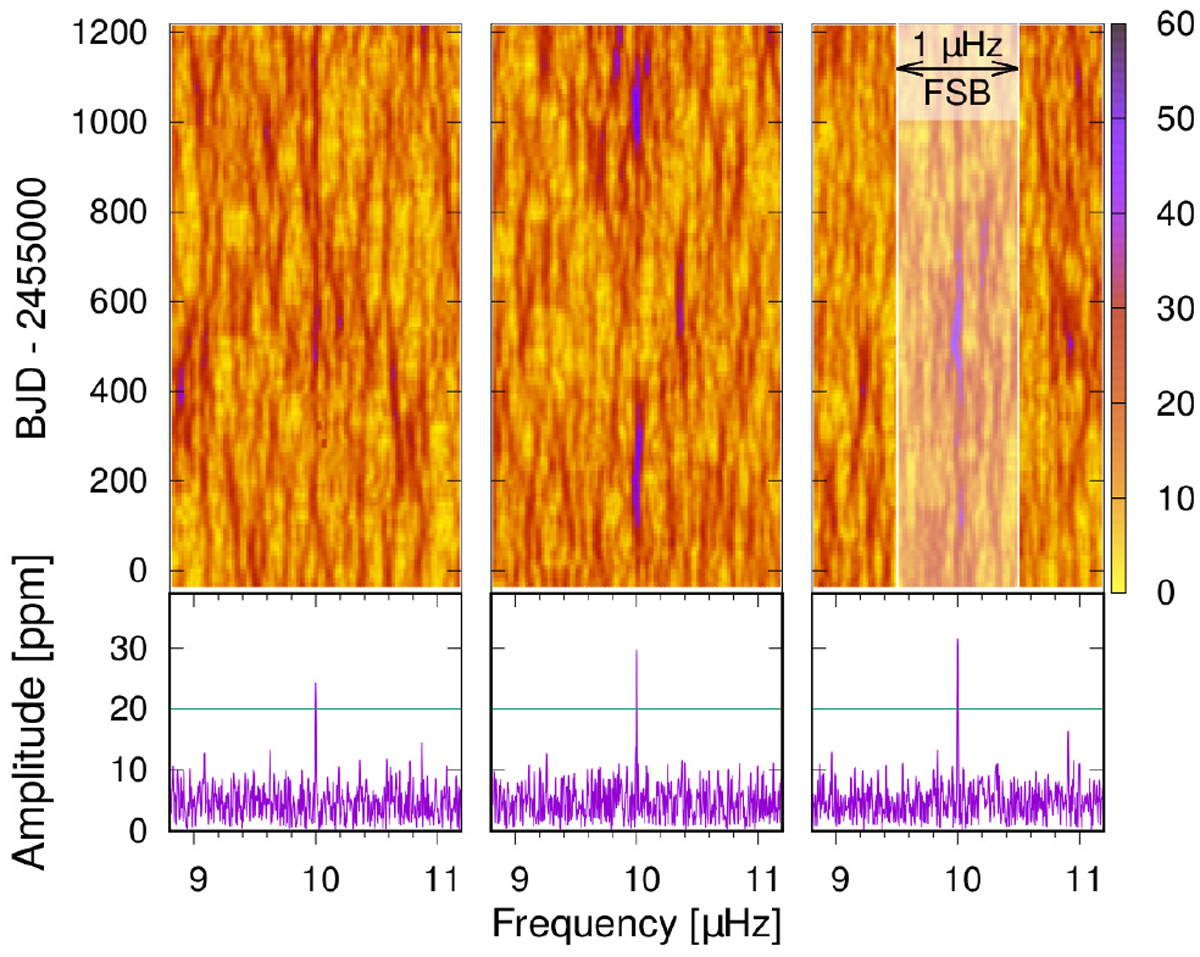
Three examples of the 200-day running FT (top panels) and FT of the complete simulated light curves (bottom panels). The amplitudes and frequencies of the simulated signals were set at 10 μHz and 30 ppm. Green lines in the bottom panel represent 4σ detection thresholds. A frequency search box of 1.0 μHz width, used to find FT signals (see text) is shown in the top right panel as the shaded white and transparent rectangle.
Current usage metrics show cumulative count of Article Views (full-text article views including HTML views, PDF and ePub downloads, according to the available data) and Abstracts Views on Vision4Press platform.
Data correspond to usage on the plateform after 2015. The current usage metrics is available 48-96 hours after online publication and is updated daily on week days.
Initial download of the metrics may take a while.