Fig. 1
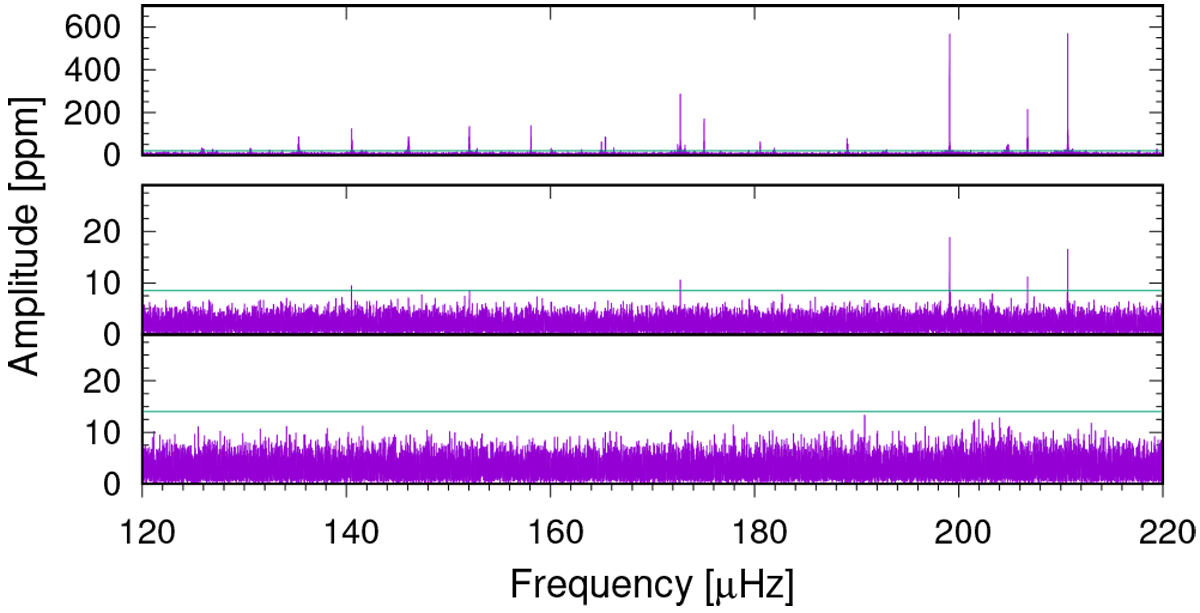
Fourier transforms of the bright neighbor KIC 10001898 and sdBV KIC 10001893 light curves extracted from LC data. The pulsation pattern of KIC 10001893 sdBV (top panel, PSF data FT) is clearly visible in the aperture data for the bright neighbor (middle panel). The FT of the PSF data for the bright neighbor (bottom panel) shows no sign of pulsations from the sdBV. Green lines show the 4σ signal detection thresholds of the light curve FTs. The amplitude scale changes in the two bottom panels.
Current usage metrics show cumulative count of Article Views (full-text article views including HTML views, PDF and ePub downloads, according to the available data) and Abstracts Views on Vision4Press platform.
Data correspond to usage on the plateform after 2015. The current usage metrics is available 48-96 hours after online publication and is updated daily on week days.
Initial download of the metrics may take a while.