Fig. A.1.
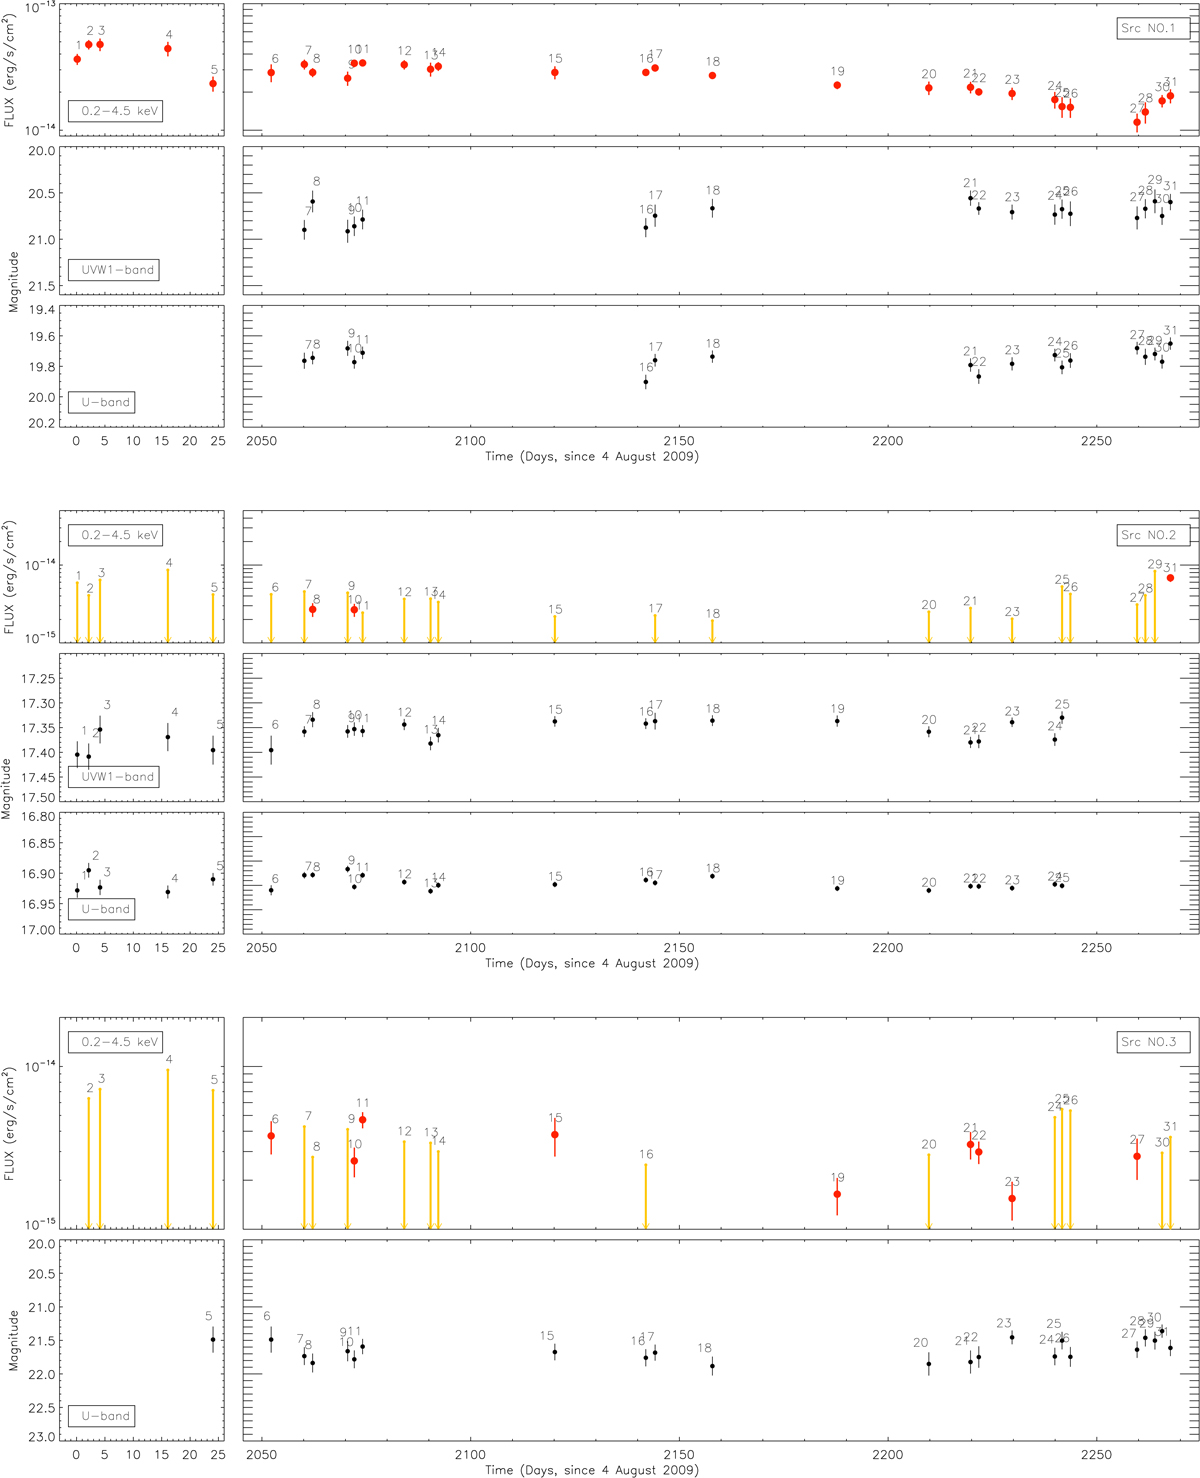
Light curve of each source over thirty-one XMM-Newton observations of EPIC cameras and OM cameras. The absorbed weighted flux (0.2–4.5 keV) of each source in the different observations is plotted over time. If the source was not detected in an observation, the upper limit is shown. In the cases of X-ray light curves, the red dots show the flux of each observation and the orange arrows show the upper limits. In optical and UV light curves, the black dots show the magnitude of the source and the grey arrows show the upper limits.
Current usage metrics show cumulative count of Article Views (full-text article views including HTML views, PDF and ePub downloads, according to the available data) and Abstracts Views on Vision4Press platform.
Data correspond to usage on the plateform after 2015. The current usage metrics is available 48-96 hours after online publication and is updated daily on week days.
Initial download of the metrics may take a while.