Fig. A.1.
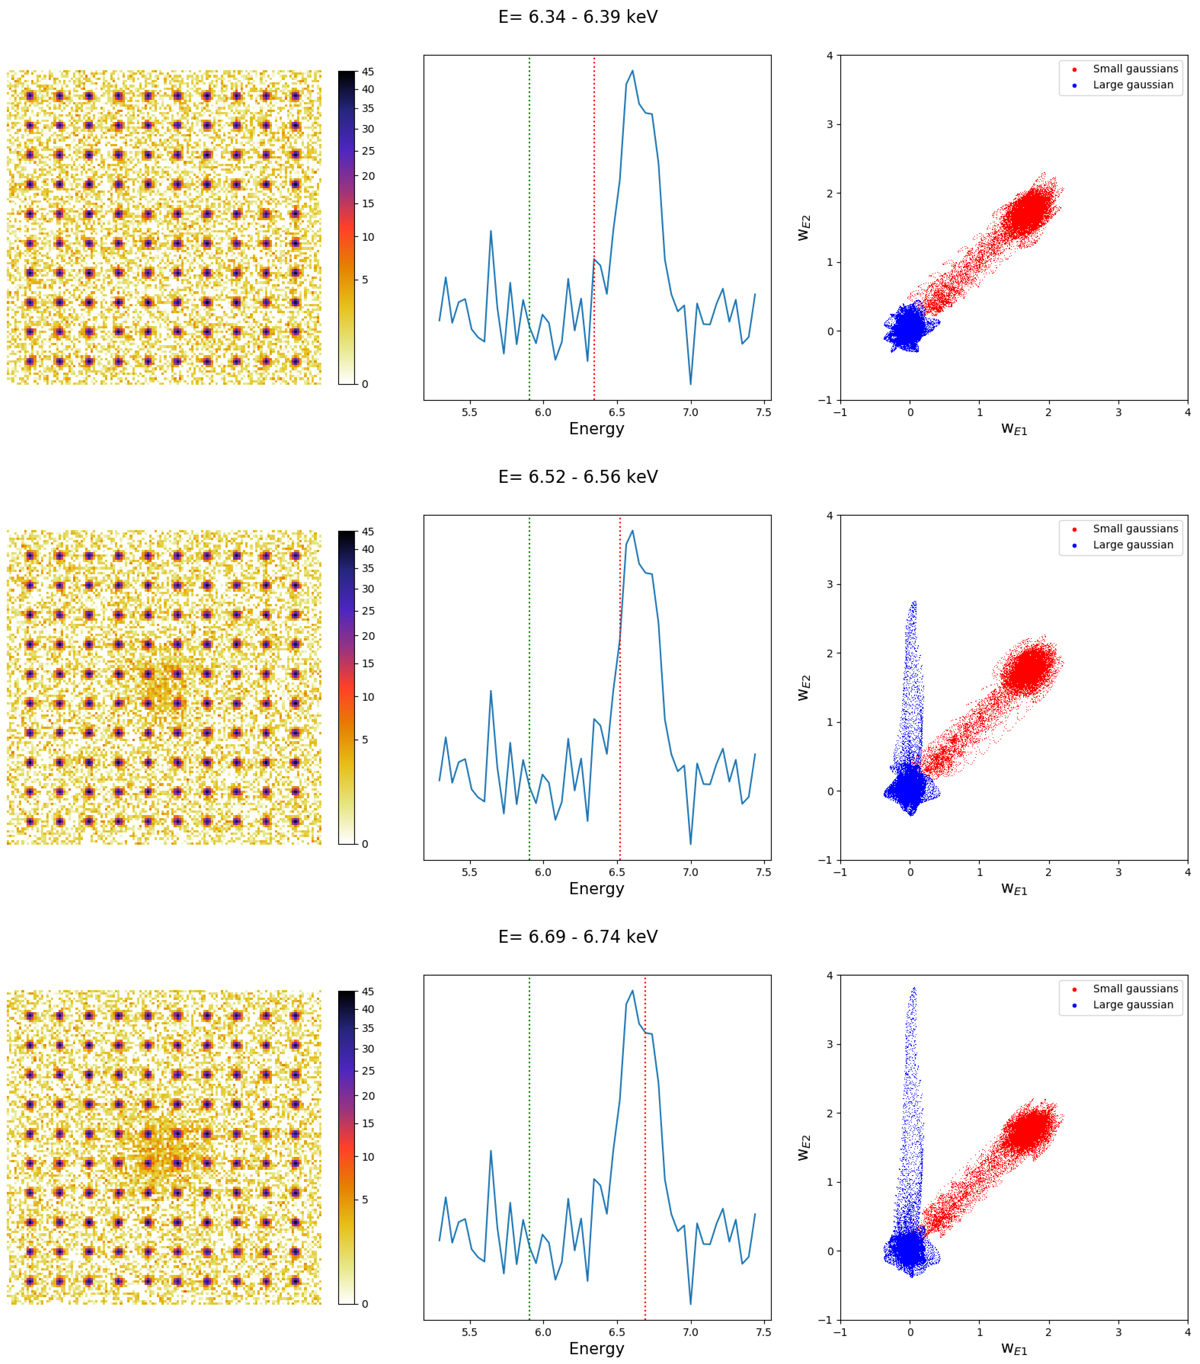
Illustration of the relevance of wavelet transforms to separate components in a cube (E, x, y) using a simple toy model. Left: slice of the cube at the current energy E2. Center: total spectrum. The green line corresponds to E1 while the red one corresponds to E2. Right: representation of the coefficients of both components in the third wavelet scale at E2 as a function of the coefficients of both components in the third wavelet scale at E1. The coefficients of the two components are clearly dissociated in the wavelet space, whereas their images are tightly entangled.
Current usage metrics show cumulative count of Article Views (full-text article views including HTML views, PDF and ePub downloads, according to the available data) and Abstracts Views on Vision4Press platform.
Data correspond to usage on the plateform after 2015. The current usage metrics is available 48-96 hours after online publication and is updated daily on week days.
Initial download of the metrics may take a while.