Fig. B.1.
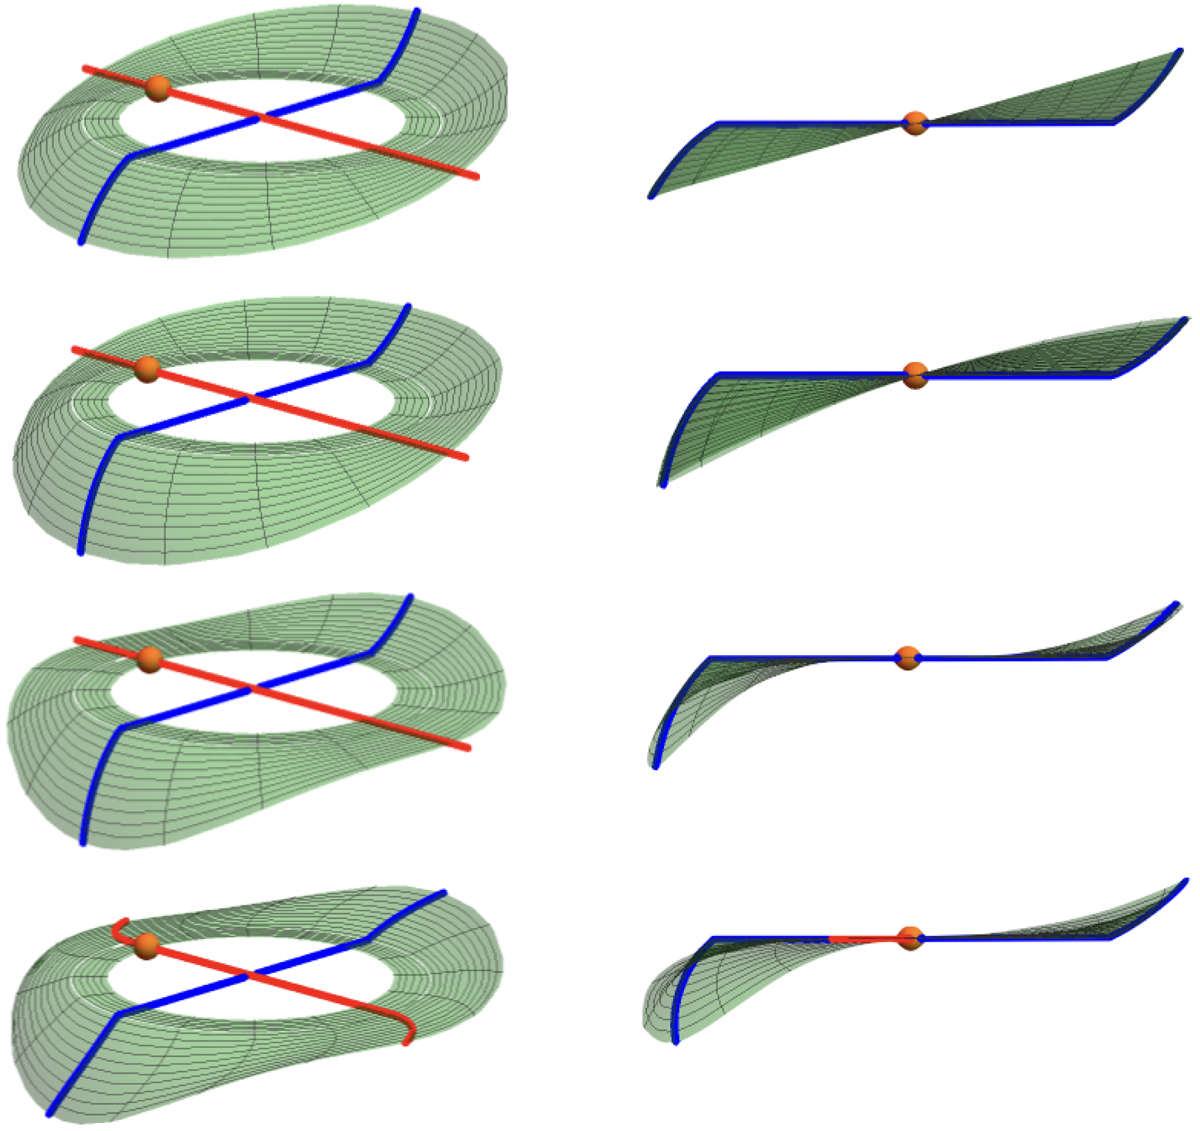
Schematic plot of a warped disc according to the three warp models (see text): First row: simple Symmetric warp. Second row: Sine Lopsided warp. Third row: S Lopsided warp. Fourth row: S Lopsided warp with a twisted line-of-nodes. The red line shows the line-of-nodes and the orange sphere marks the position of the Sun. The blue line, perpendicular to the line-of-nodes, shows the maximum amplitude of the warp. The amplitude values for the schematic plot have been increased for the sake of clarity.
Current usage metrics show cumulative count of Article Views (full-text article views including HTML views, PDF and ePub downloads, according to the available data) and Abstracts Views on Vision4Press platform.
Data correspond to usage on the plateform after 2015. The current usage metrics is available 48-96 hours after online publication and is updated daily on week days.
Initial download of the metrics may take a while.