Fig. 16.
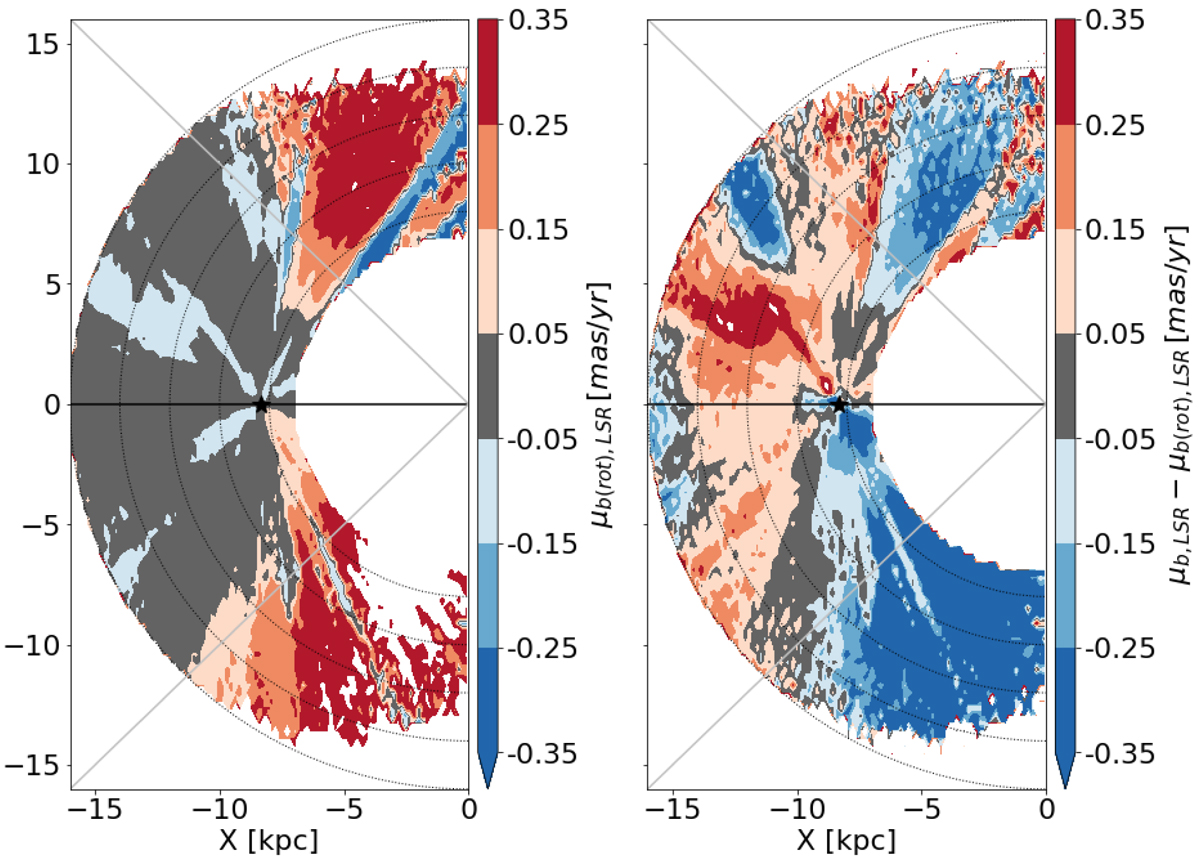
Contribution of a flat rotation curve (with the selection function of our sample) to the proper motion in latitude. Left panel: given the spatial distribution of the RGB sample we compute the contribution to the proper motion in latitude with respect to the LSR of a flat rotation curve. Right panel: we subtract from the proper motion in latitude the contribution due to a flat rotation curve. Bin size is the same as in the RGB sample in Fig. 8. Black and grey lines and the black small star are the same as in Fig. 8.
Current usage metrics show cumulative count of Article Views (full-text article views including HTML views, PDF and ePub downloads, according to the available data) and Abstracts Views on Vision4Press platform.
Data correspond to usage on the plateform after 2015. The current usage metrics is available 48-96 hours after online publication and is updated daily on week days.
Initial download of the metrics may take a while.