Fig. 14.
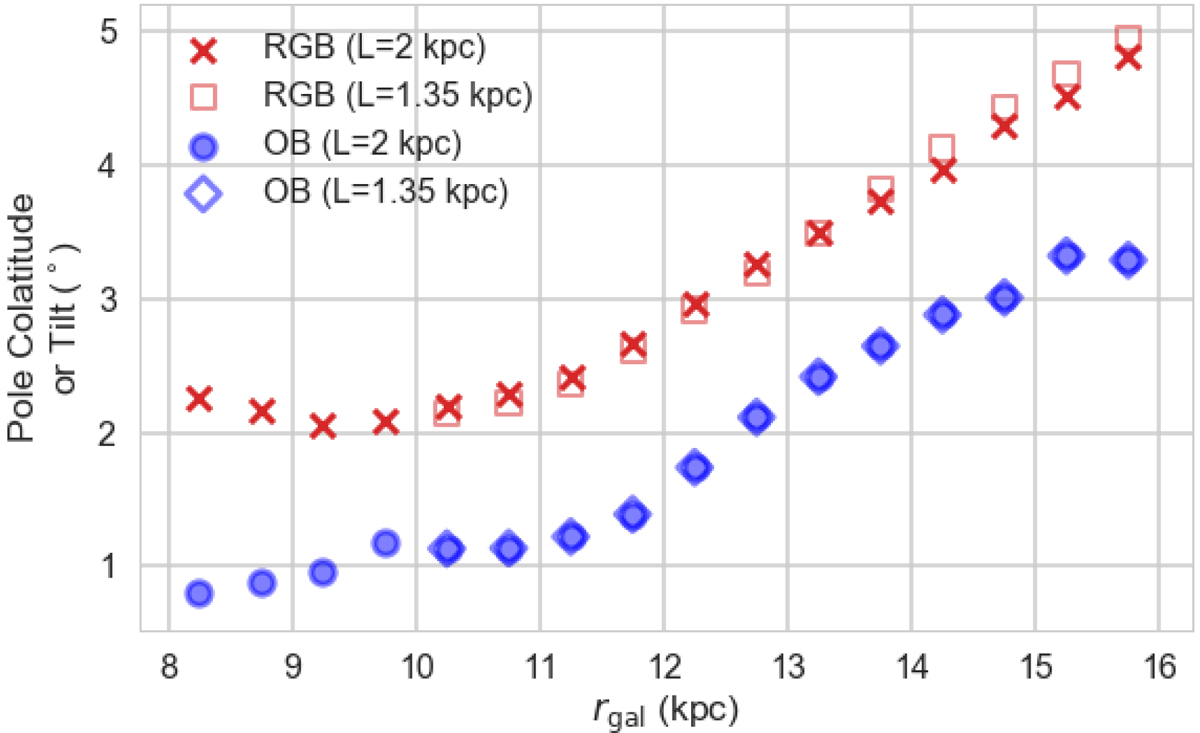
Comparison of results for the nGC3 method obtained for two different prior scale lengths, L = 2 kpc (crosses and filled circles) and L = 1.35 kpc (open squares and open diamonds) in red for the RGB sample and in blue for the OB sample. We show the inclination angles of the main nGC3 PCM peak (crosses in Fig. 13) as a function of rgal. The plateau in the tilt angle observed for the RGBs (rgal ≲ 9 kpc) is due to contamination from the central peak affecting the centroid when the two peaks are close.
Current usage metrics show cumulative count of Article Views (full-text article views including HTML views, PDF and ePub downloads, according to the available data) and Abstracts Views on Vision4Press platform.
Data correspond to usage on the plateform after 2015. The current usage metrics is available 48-96 hours after online publication and is updated daily on week days.
Initial download of the metrics may take a while.