Fig. 13.
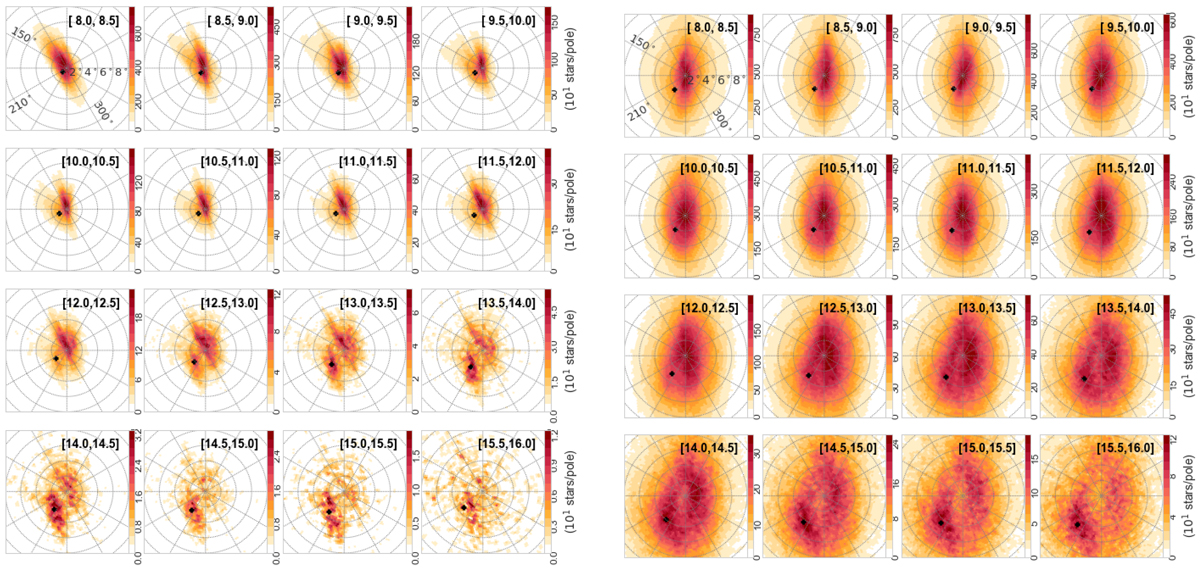
nGC3 PCMs for the OB (left panels) and RGB samples (right panels). The corresponding rgal range is indicated at the top right of each panel. The cross indicates the centroid (weighed by pole counts) of the main off-pole peak of the PCM. The maps were produced using a grid spacing and tolerance of ![]() . The colour scales linearly with star counts, indicating larger values with darker colours. In all panels, dotted circles and radial lines correspond to parallels at co-latitudes increasing by 2° and meridians at azimuths every 30°, respectively.
. The colour scales linearly with star counts, indicating larger values with darker colours. In all panels, dotted circles and radial lines correspond to parallels at co-latitudes increasing by 2° and meridians at azimuths every 30°, respectively.
Current usage metrics show cumulative count of Article Views (full-text article views including HTML views, PDF and ePub downloads, according to the available data) and Abstracts Views on Vision4Press platform.
Data correspond to usage on the plateform after 2015. The current usage metrics is available 48-96 hours after online publication and is updated daily on week days.
Initial download of the metrics may take a while.