Fig. 10.
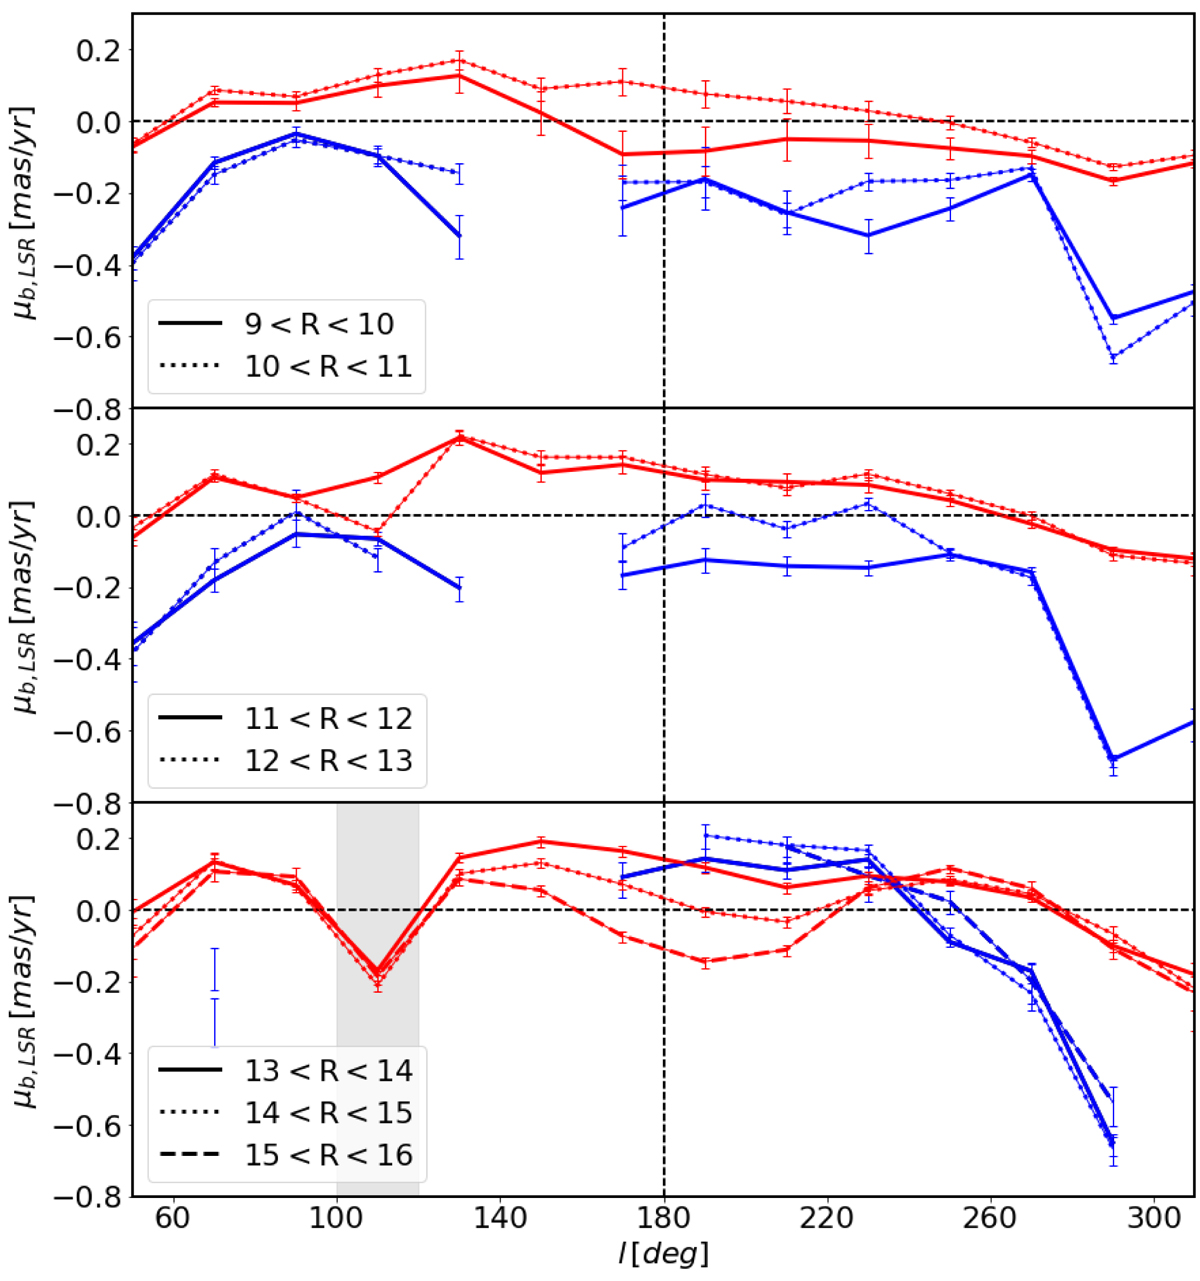
LonKin method applied to the OB sample (blue lines) and RGB sample (red lines). We divide into three panels according to Galactocentric rings, from the inner to the outer disc, from top to bottom. In each panel, different distance bins are indicated with solid, dotted and dashed lines consistently from nearest to farthest. The shaded vertical region in the bottom panel corresponds to the “blob” (see text for details). The line shows the median of the particles in bins of 20° and the error bars show the lower and upper 1σ uncertainty in the position of the median, including the uncertainty in the solar velocity in quadrature.
Current usage metrics show cumulative count of Article Views (full-text article views including HTML views, PDF and ePub downloads, according to the available data) and Abstracts Views on Vision4Press platform.
Data correspond to usage on the plateform after 2015. The current usage metrics is available 48-96 hours after online publication and is updated daily on week days.
Initial download of the metrics may take a while.