Fig. 8.
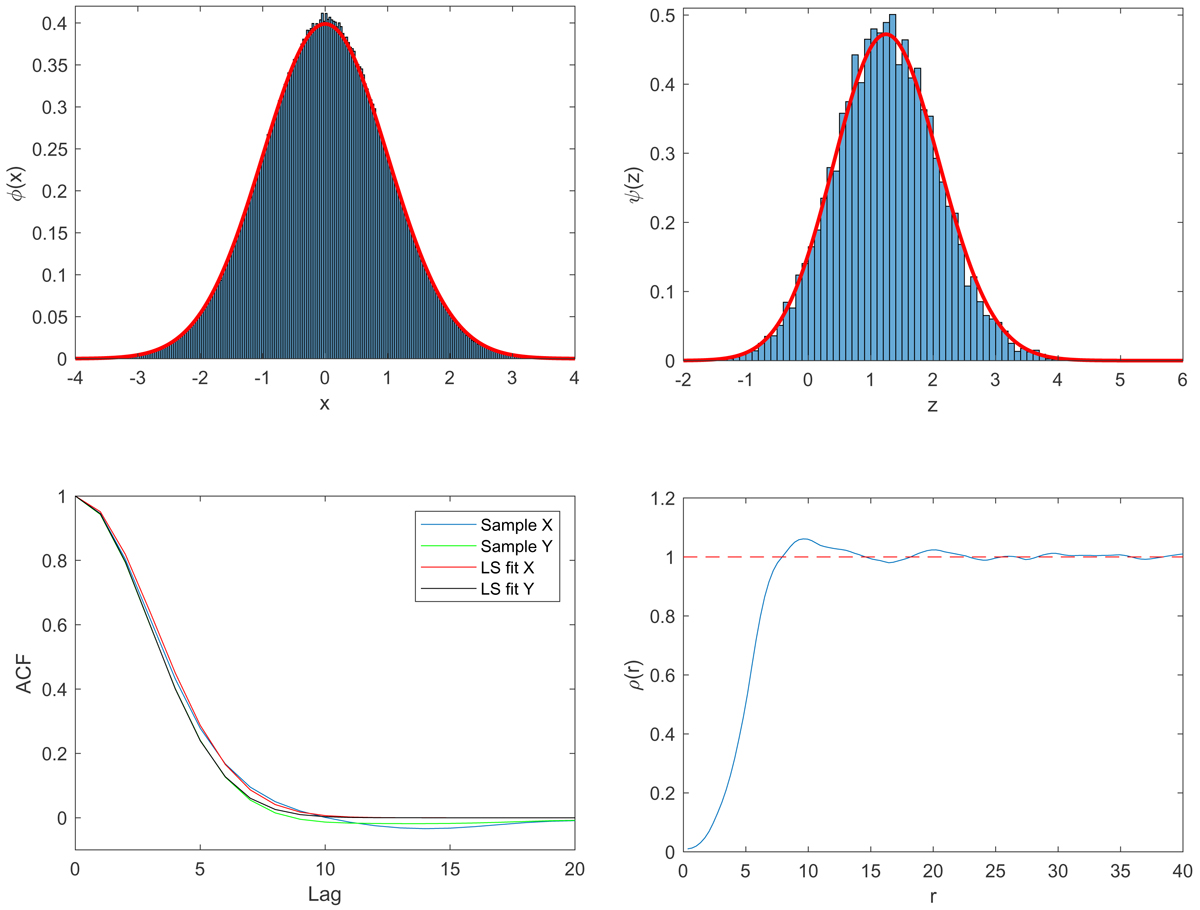
Checks of the conditions of applicability of the detection procedure for the interferometric ALMA map (see text). Top-left panel: histogram of the values of the pixels vs. the standard Gaussian PDF ϕ(x). Top-right panel: histogram of the peak values vs. the theoretical PDF ψ(z) given by Eq. (10). Bottom-left panel: slices along the X and the Y directions of the sample autocorrelation function vs. the corresponding slices of a least-square fit with a two-dimensional Gaussian function. Bottom-right panel: sample pair correlation function ρ(r) of the peaks. The red line provides the theoretical ρ(r) due to a CSRPP.
Current usage metrics show cumulative count of Article Views (full-text article views including HTML views, PDF and ePub downloads, according to the available data) and Abstracts Views on Vision4Press platform.
Data correspond to usage on the plateform after 2015. The current usage metrics is available 48-96 hours after online publication and is updated daily on week days.
Initial download of the metrics may take a while.