Fig. 6.
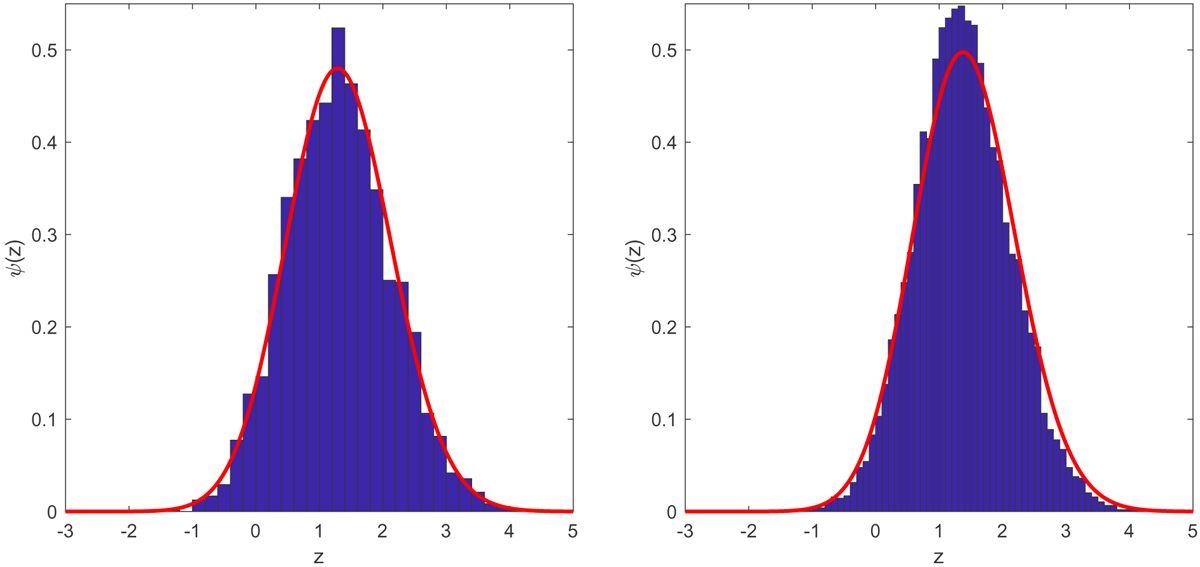
Check for the applicability of the proposed detection procedure for two different situations (see text). Left panel: histogram H(z) vs. ψ(z) from Eq. (10) for a numerical realization of a zero-mean unit-variance Gaussian random field with autocorrelation given by a circular Gaussian with dispersion set to three pixels. Right panel: as in the left panel but with the dispersion of the Gaussian autocorrelation function set to one pixel.
Current usage metrics show cumulative count of Article Views (full-text article views including HTML views, PDF and ePub downloads, according to the available data) and Abstracts Views on Vision4Press platform.
Data correspond to usage on the plateform after 2015. The current usage metrics is available 48-96 hours after online publication and is updated daily on week days.
Initial download of the metrics may take a while.