Fig. 1.
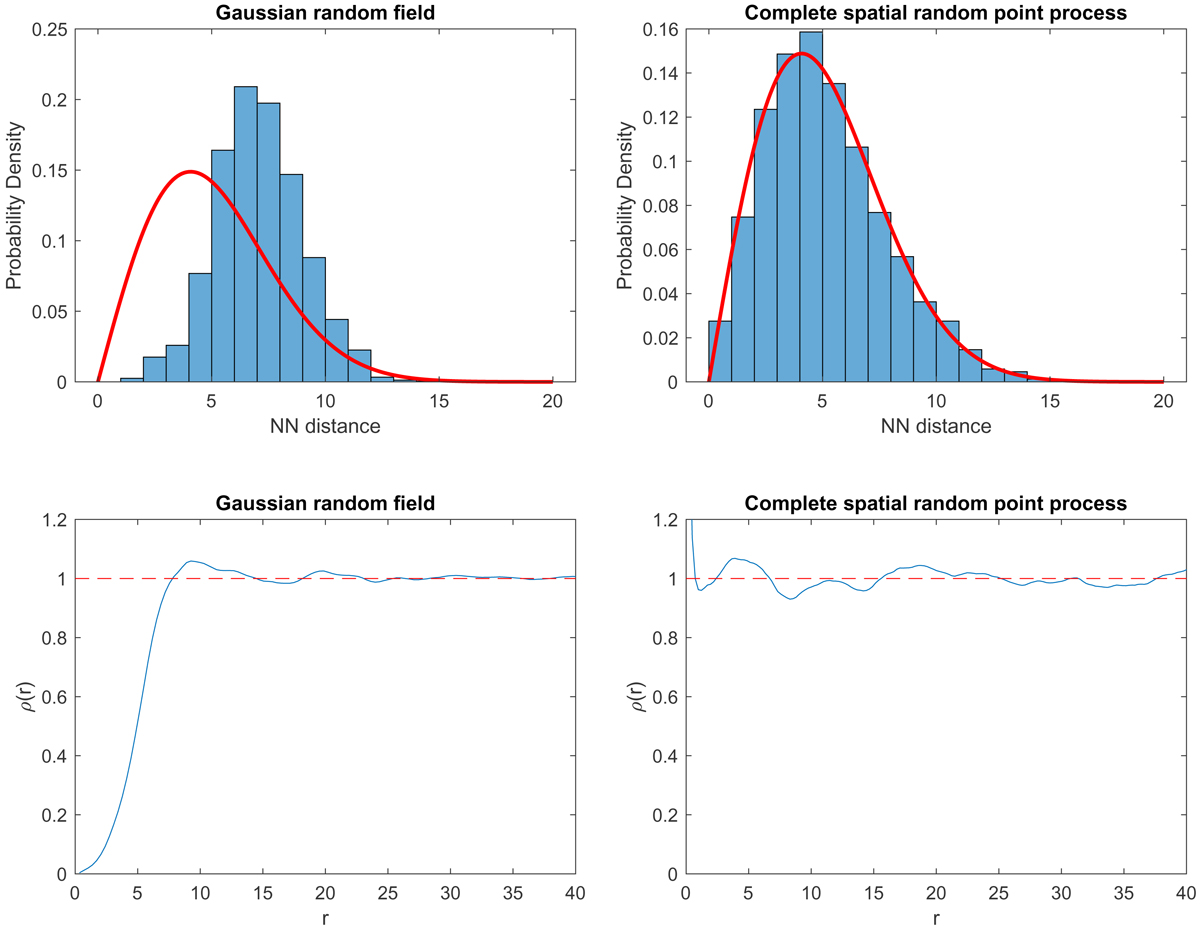
Statistical characteristics of the spatial distribution of a set of points obtained by means of a GRF and a complete spatial random point process (CSRPP). Top-left panel: histogram of nearest neighbor distances of the peaks of a simulated zero-mean unit-variance GRF with size 500 × 500 pixels and autocorrelation function given by a circular Gaussian with dispersion set to three pixels. Since in this GRF the peaks have coordinates given by integer numbers, in order to mimic a continuous spatial distribution, they have been added to a uniform random number taking its value in the range (−0.5, +0.5]. Bottom-left panel: sample pair correlation function ρ(r) of the peaks in the same GRF. Top-right and bottom-right panels: figures corresponding to the left panels for a CSRPP with the same sizes and containing a number of points equal to the number of peaks as in the GRF. The red lines provide the corresponding theoretical PDFs due to a CSRPP.
Current usage metrics show cumulative count of Article Views (full-text article views including HTML views, PDF and ePub downloads, according to the available data) and Abstracts Views on Vision4Press platform.
Data correspond to usage on the plateform after 2015. The current usage metrics is available 48-96 hours after online publication and is updated daily on week days.
Initial download of the metrics may take a while.