Fig. 3.
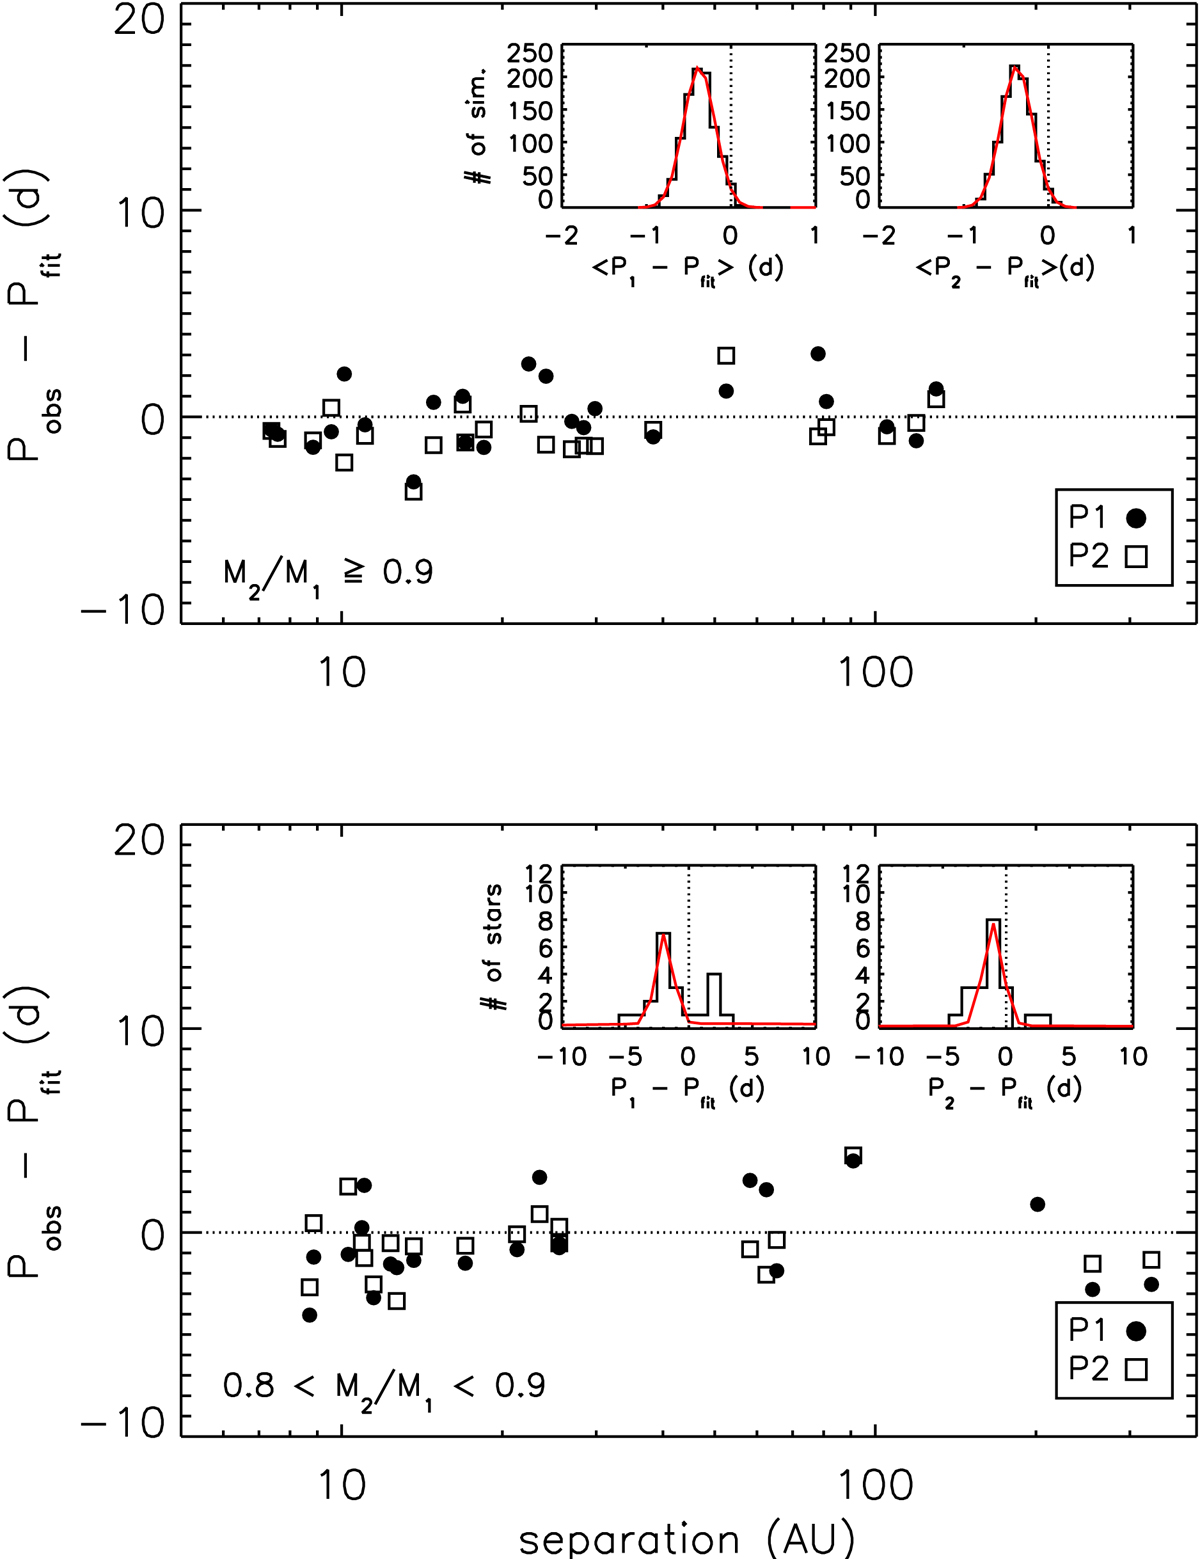
Distribution of residuals of periods with respect to the fit (solid line in Fig. 2) for close binaries with about equal-mass components M2/M1 ≥ 0.9 (top panel) and with non-equal-mass components 0.8 ≤ M2/M1 < 0.9 (bottom panel). The top inner plots show the distribution of average ⟨P − Pfit⟩ residuals from Monte Carlo simulations (see text for explanation) with a Gaussian fit over plotted; the bottom inner plots show the distribution of the P − Pfit residuals.
Current usage metrics show cumulative count of Article Views (full-text article views including HTML views, PDF and ePub downloads, according to the available data) and Abstracts Views on Vision4Press platform.
Data correspond to usage on the plateform after 2015. The current usage metrics is available 48-96 hours after online publication and is updated daily on week days.
Initial download of the metrics may take a while.