Fig. 2.
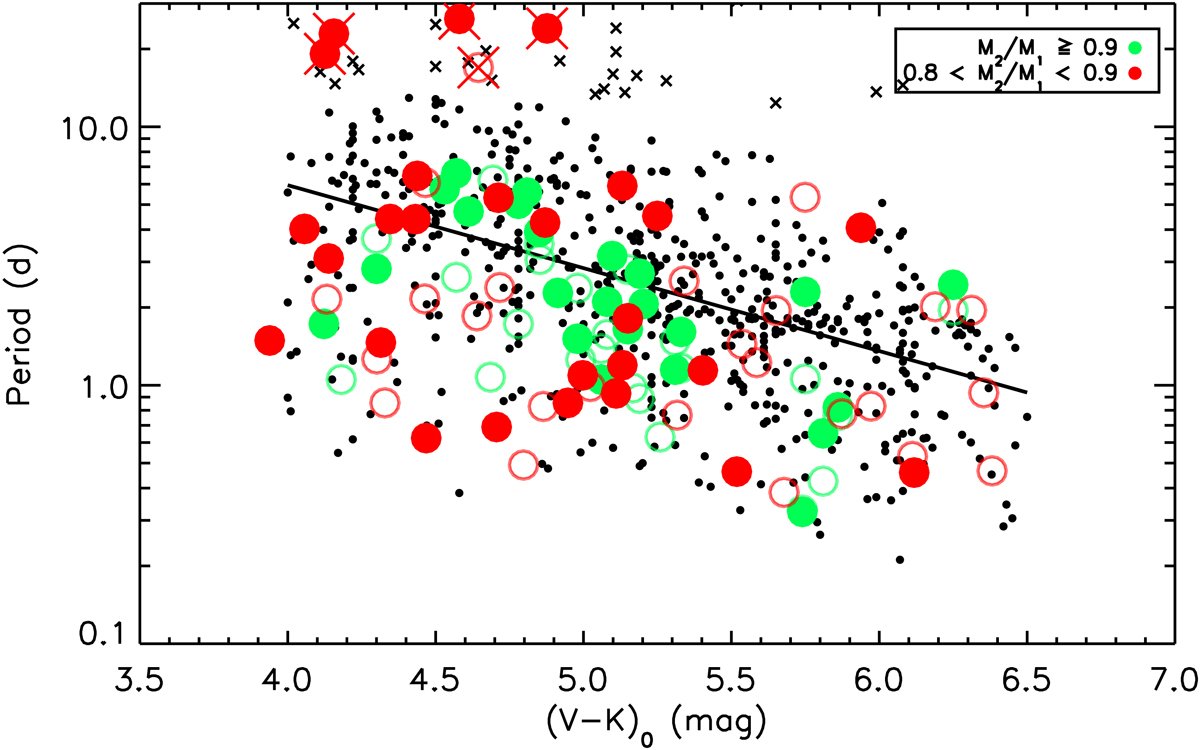
Distribution of stellar rotation periods vs. dereddened colour for candidate members of the Upper Scorpius association from Rebull et al. (2018) in the M0–M6 spectral range. Small dots are the rotation periods of single stars as listed in Table 1 of Rebull et al. (2018). Filled and open bullets are periods P1 and P2 of components of close binaries, respectively. Components of binary systems whose mass ratio is M2/M1 ≥ 0.9 (respectively 0.8 ≤ M2/M1 ≤ 0.9) are shown in green (respectively red). The solid line is a fit to the rotation periods of single stars (see Eq. (5)). Crossed symbols are outliers excluded from the fit computation and the following analysis.
Current usage metrics show cumulative count of Article Views (full-text article views including HTML views, PDF and ePub downloads, according to the available data) and Abstracts Views on Vision4Press platform.
Data correspond to usage on the plateform after 2015. The current usage metrics is available 48-96 hours after online publication and is updated daily on week days.
Initial download of the metrics may take a while.