Fig. 2.
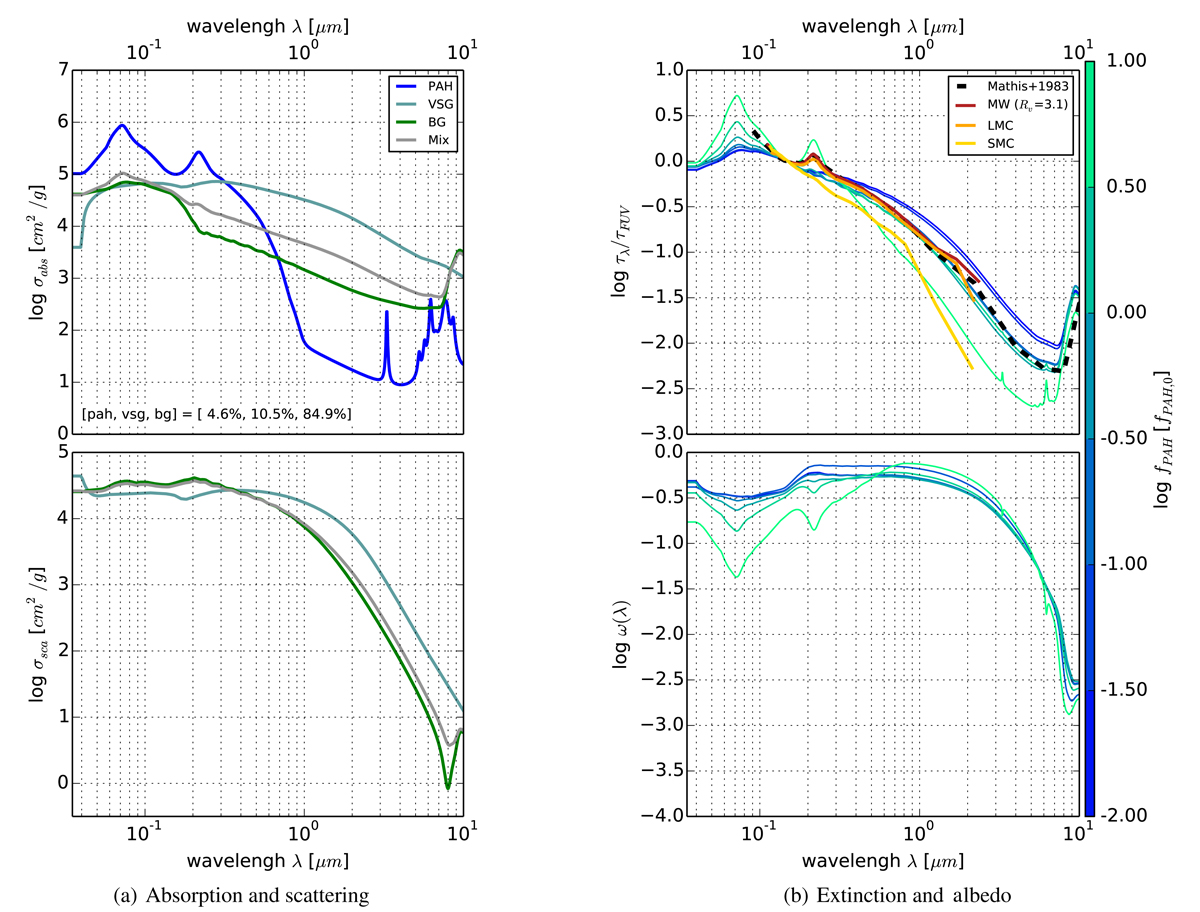
Panel a: absorption (σabs, upper panel) and scattering (σsca cross sections, lower panel). In each panel, PAH, VSG and BG are shown in blue, light blue and green, respectively. The gray curve shows the total absorption. We assume fPAH = fPAH, 0 = 4.57%. The mass fraction of BG and VSG (given in the left panel) are then deduced using the random-walk technique. Panel b: extinction (τλ) curves normalized to the FUV band. We compare those extinction curves to observational measurements: Mathis et al. (1983) Milky Way (dashed black line) and Gordon et al. (2003) for SMC (gold solid line), LMC (orange solid line) and Milky Way (red solid line). Lower panel: Albedo (ωλ). In the two panels, the color of the curves is linked to the PAH fraction assumed, from 10−2 × fPAH, 0 (blue) to 10 × fPAH, 0 (green).
Current usage metrics show cumulative count of Article Views (full-text article views including HTML views, PDF and ePub downloads, according to the available data) and Abstracts Views on Vision4Press platform.
Data correspond to usage on the plateform after 2015. The current usage metrics is available 48-96 hours after online publication and is updated daily on week days.
Initial download of the metrics may take a while.