Fig. A.2.
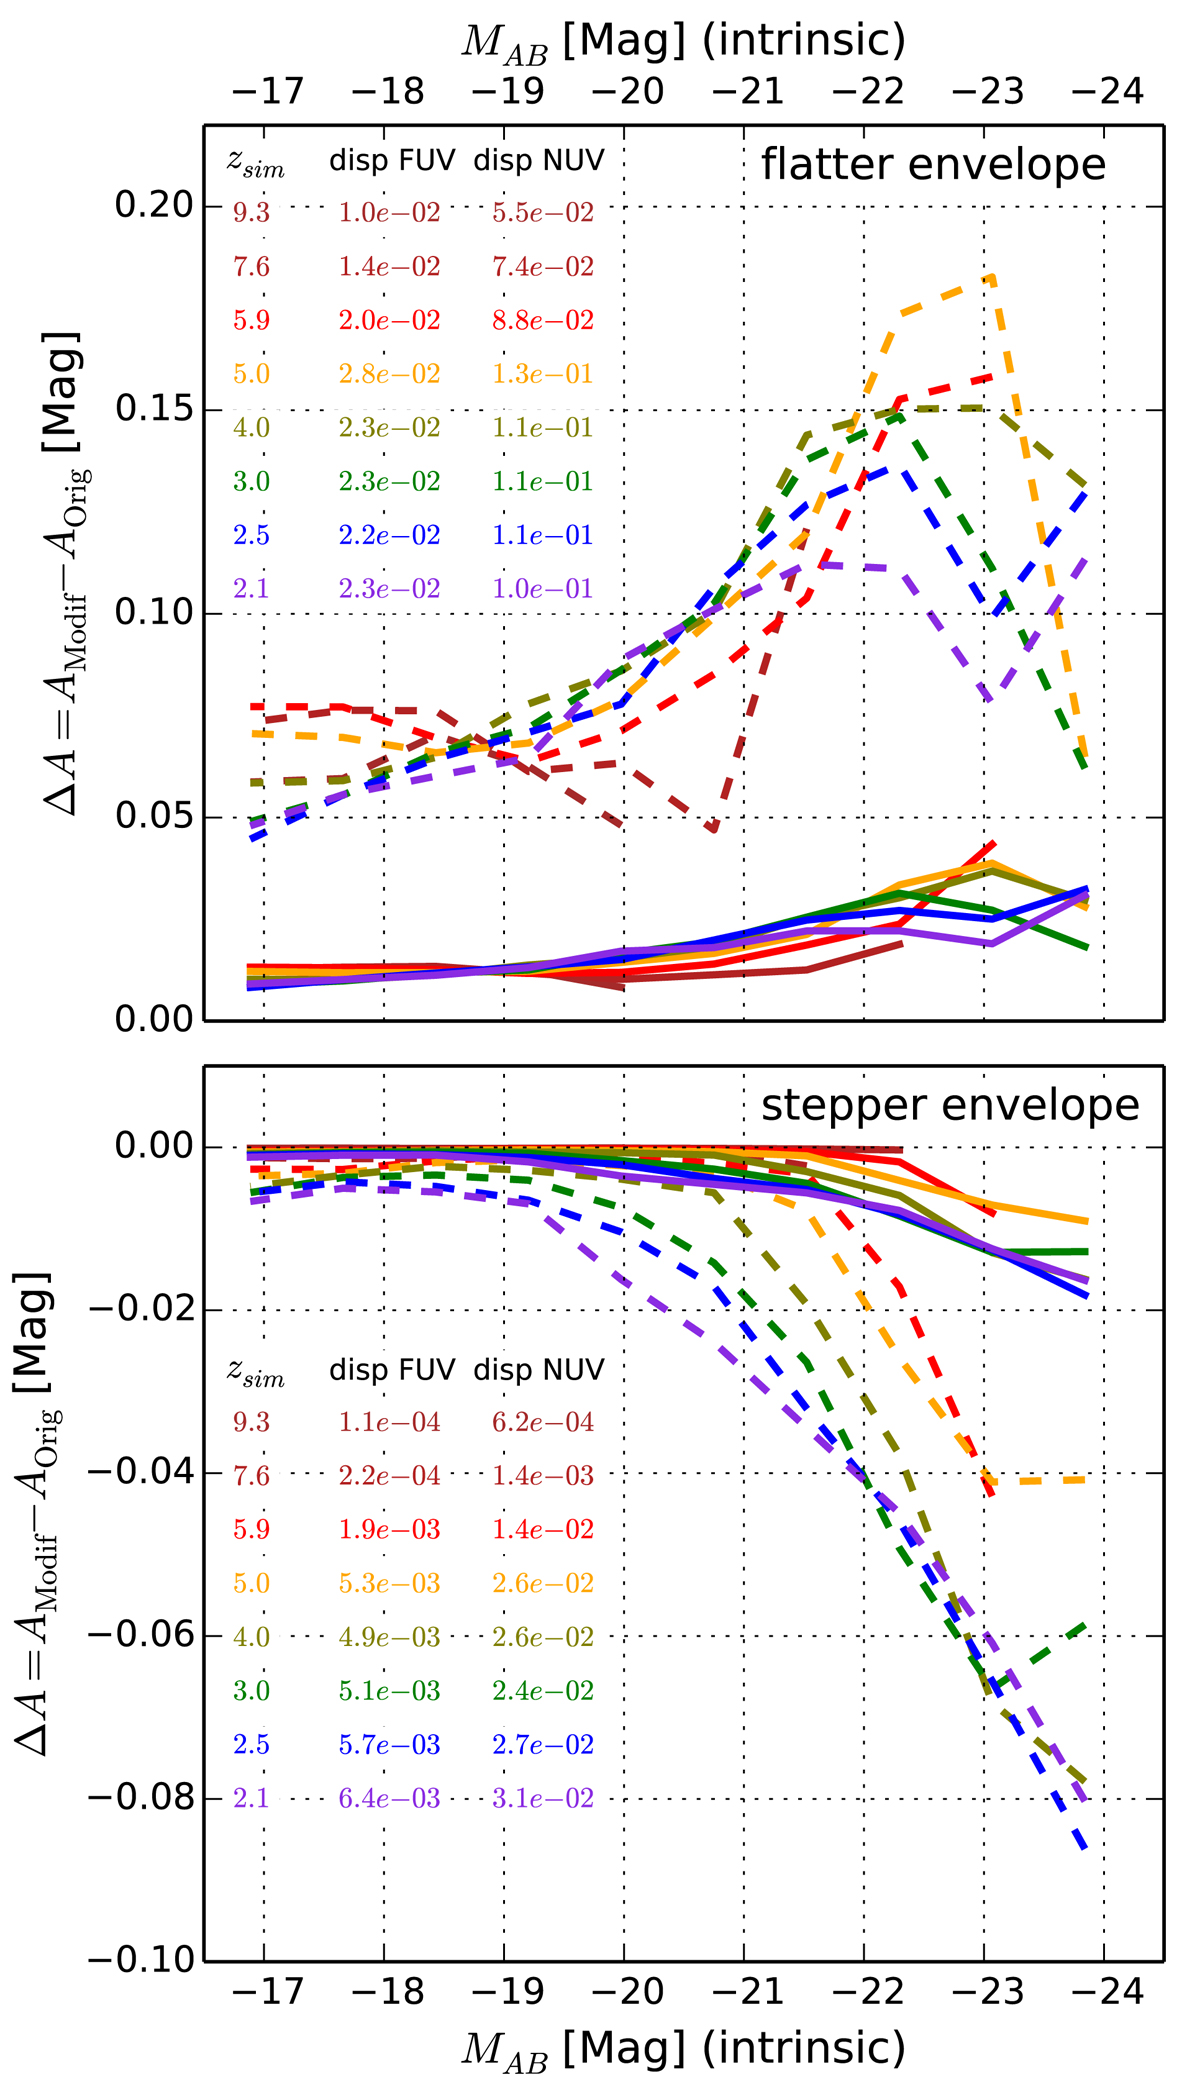
Impact of the modified Zg − fPAH relations on the effective FUV and NUV attenuation (Eq. (21)). The difference between the original and modified relation is plotted as a function of the intrinsic FUV/NUV magnitude that does not evolve between the two configurations. The upper and lower panels show the impacts produced by the flatter and steeper relations, respectively. The solid and the dashed colored lines are associated with the FUV and NUV band, respectively. The effective attenuation, AModif and AOrig, are computed according to the modified and original Zg − fPAH relations, respectively. Each colored line indicates a specific redshift from z = 9.3 to z = 2.1. The explicit list is given in the left side of the panels. The two other columns list the average dispersion measured for the FUV and NUV band around the mean relation.
Current usage metrics show cumulative count of Article Views (full-text article views including HTML views, PDF and ePub downloads, according to the available data) and Abstracts Views on Vision4Press platform.
Data correspond to usage on the plateform after 2015. The current usage metrics is available 48-96 hours after online publication and is updated daily on week days.
Initial download of the metrics may take a while.