Fig. 14
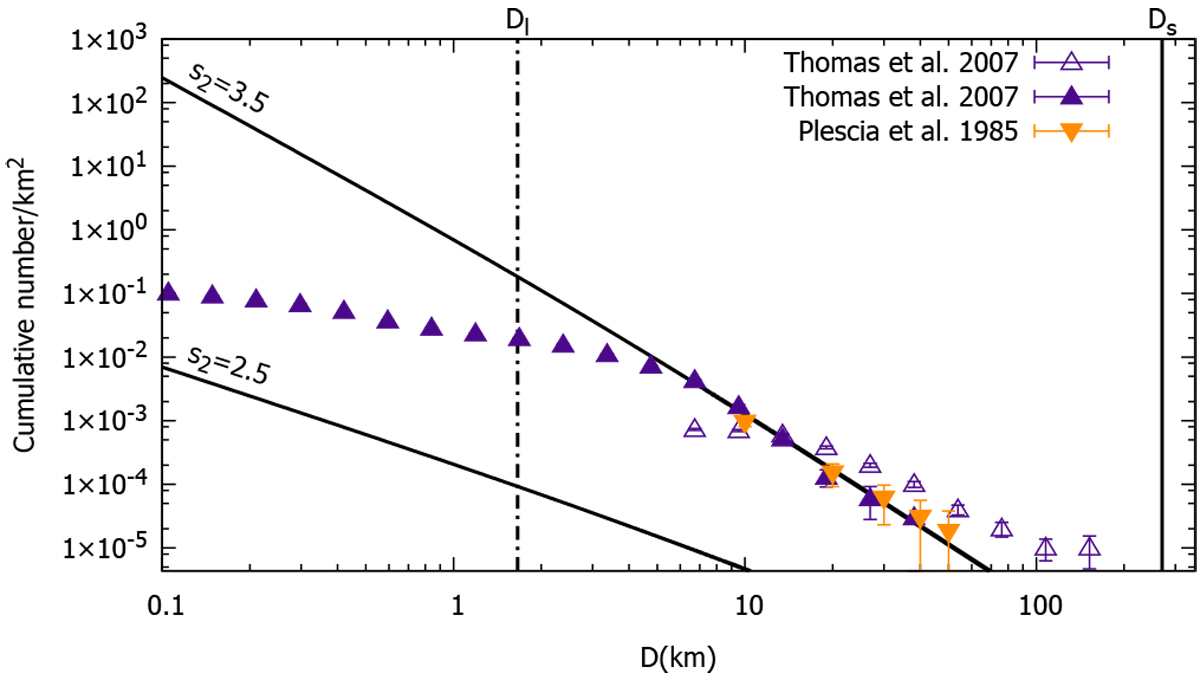
Cumulative number of craters per square kilometer as a function of crater diameter D for Hyperion. Solid lines refer to our model calculated for both values of the impactor size distribution index (top line is for s2 = 3.5 and bottom line is for s2 = 2.5) and color points represent the observations presented in Plescia & Boyce (1985) and Thomas et al. (2007), where two different areas of the surface of the satellite were studied. The dashed vertical line indicates the strength-to-gravity transition crater diameter Dl and the solidvertical line indicates its mean body diameter Ds.
Current usage metrics show cumulative count of Article Views (full-text article views including HTML views, PDF and ePub downloads, according to the available data) and Abstracts Views on Vision4Press platform.
Data correspond to usage on the plateform after 2015. The current usage metrics is available 48-96 hours after online publication and is updated daily on week days.
Initial download of the metrics may take a while.