Free Access
Fig. A.4
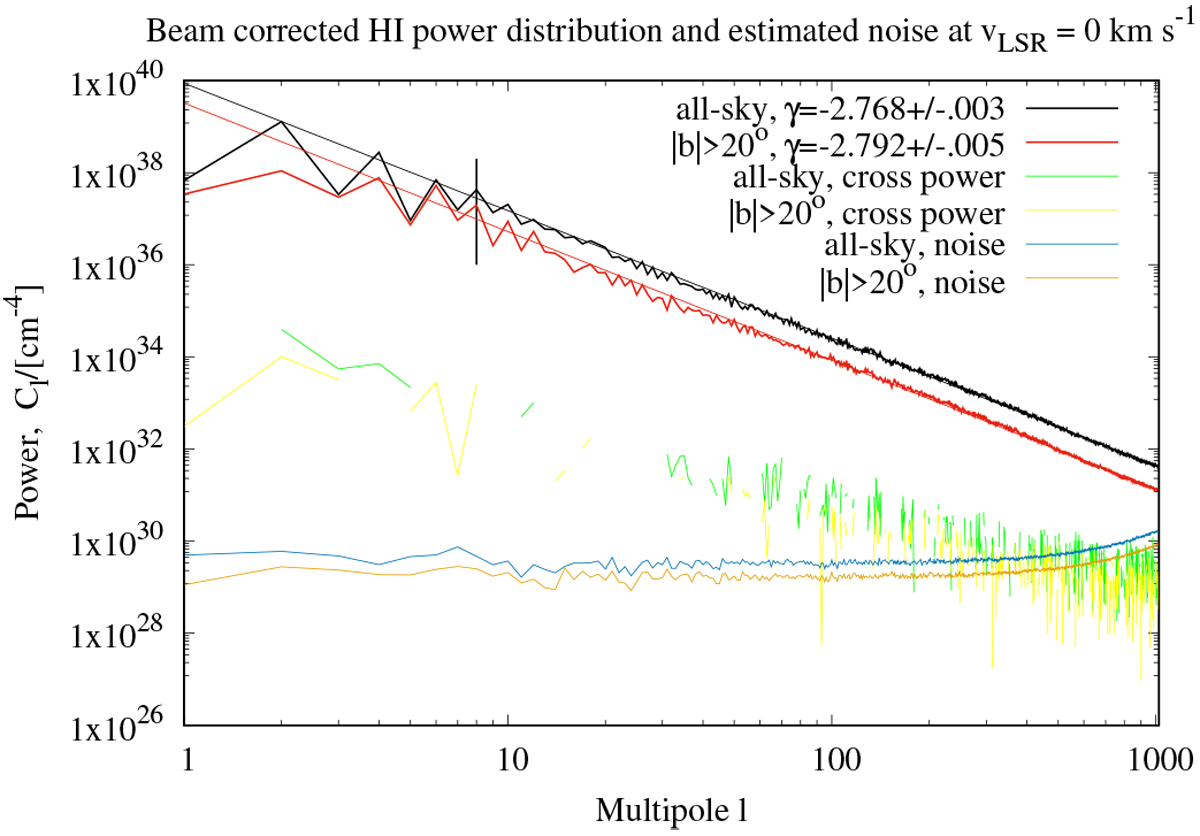
Beam corrected power distribution ![]() for single-channel column densities at vLSR = 0 km s−1, all-sky (black) and |b| > 20° (red). The estimated noise power
for single-channel column densities at vLSR = 0 km s−1, all-sky (black) and |b| > 20° (red). The estimated noise power ![]() according to Eq. (A.6) is shown in cyan and orange. The noise cross power term
according to Eq. (A.6) is shown in cyan and orange. The noise cross power term ![]() is shown in green and yellow; only positive values are shown.
is shown in green and yellow; only positive values are shown.
Current usage metrics show cumulative count of Article Views (full-text article views including HTML views, PDF and ePub downloads, according to the available data) and Abstracts Views on Vision4Press platform.
Data correspond to usage on the plateform after 2015. The current usage metrics is available 48-96 hours after online publication and is updated daily on week days.
Initial download of the metrics may take a while.