Fig. A.2
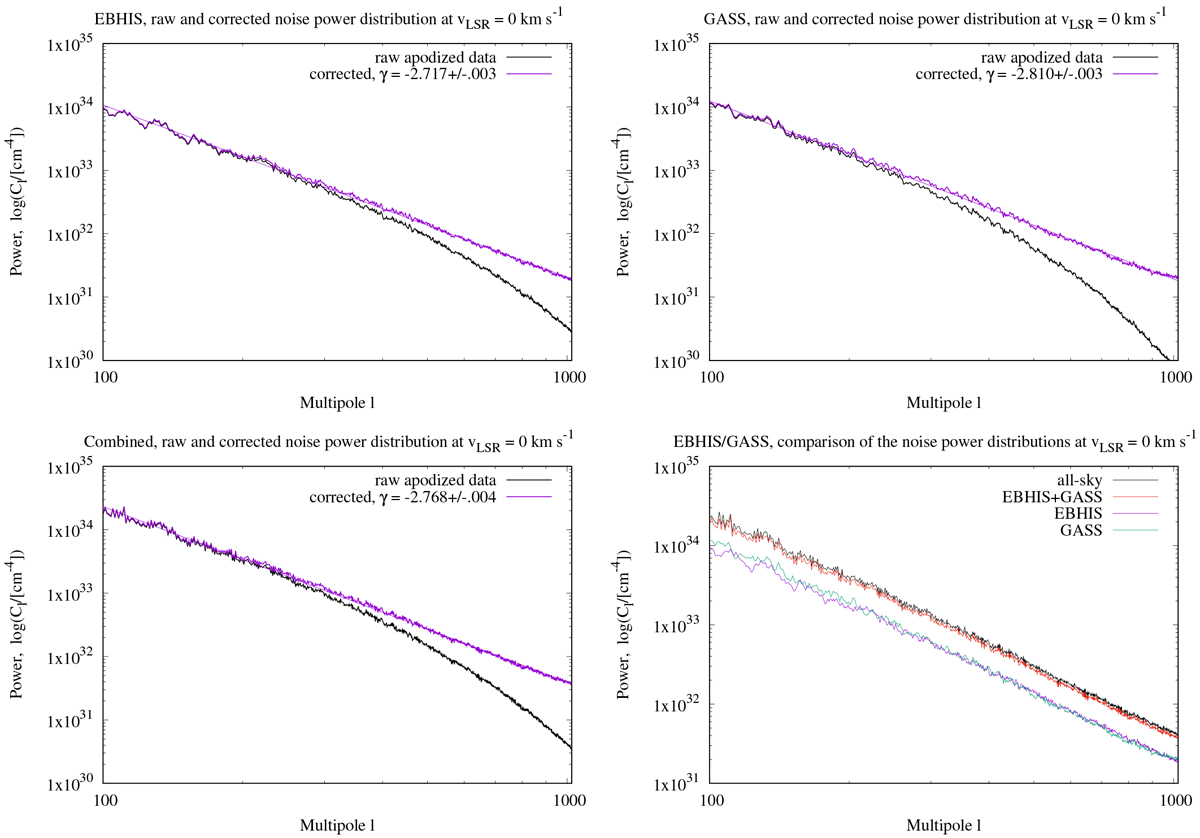
Power distributions at vLSR = 0 km s−1, comparing single-channel H I column densities for EBHIS (top left) and GASS (top right) with the all-sky combination of both surveys (bottom left). The black lines indicate power spectra derived from raw observations, the magenta lines are beam corrected power spectra with fits. On the lower panel to the right we compare the beam corrected power spectra.
Current usage metrics show cumulative count of Article Views (full-text article views including HTML views, PDF and ePub downloads, according to the available data) and Abstracts Views on Vision4Press platform.
Data correspond to usage on the plateform after 2015. The current usage metrics is available 48-96 hours after online publication and is updated daily on week days.
Initial download of the metrics may take a while.