Fig. 23
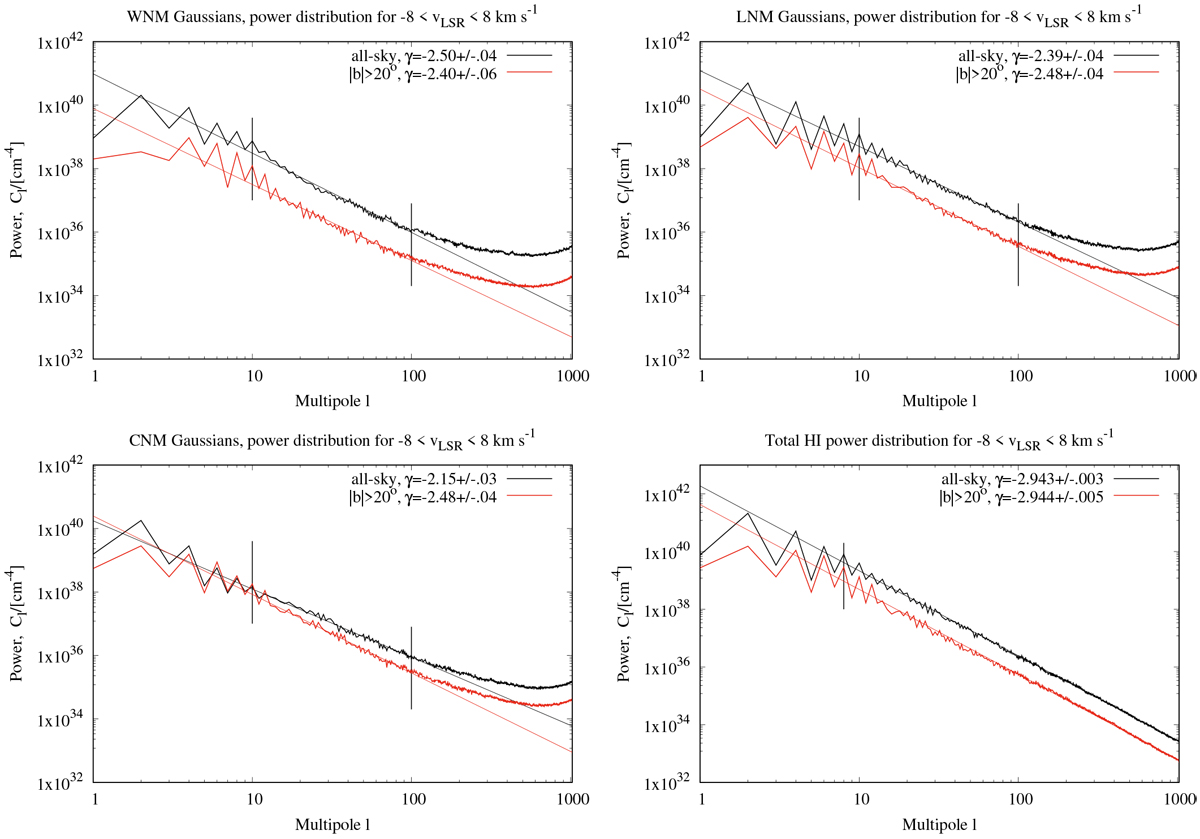
Power distributions for different H I phases at − 8 < vLSR < 8 km s−1. Top left: WNM; top right: LNM; bottom left: CNM; and bottom right: sum of all phases with uncertainties from the Gaussian decomposition (cyan and orange). Black lines show all-sky data; red lines are for |b| > 20°. Spectral indices γ for CNM, LNM, and CNM are derived at 10 < l < 100 for the sum of all phases at l > 8, as indicated by the vertical lines.
Current usage metrics show cumulative count of Article Views (full-text article views including HTML views, PDF and ePub downloads, according to the available data) and Abstracts Views on Vision4Press platform.
Data correspond to usage on the plateform after 2015. The current usage metrics is available 48-96 hours after online publication and is updated daily on week days.
Initial download of the metrics may take a while.