Fig. 8.
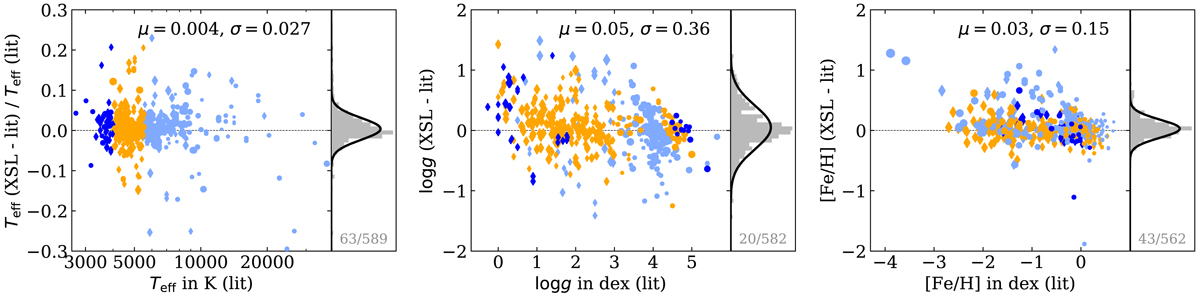
Comparison between our adopted parameters and the literature compilation. The standard deviation and mean of the differences are written and the corresponding curve is shown. The number of clipped observations compared to the total number of literature values is presented in the lower right corner of each of the panels. The colour of the points relates to Teff; the size of the points to [Fe/H], and giants and dwarfs (logg limit 3.0) are indicated by diamonds and circles, respectively. In the Teff and logg panels, two and four outliers, respectively, are not shown (various types of stars).
Current usage metrics show cumulative count of Article Views (full-text article views including HTML views, PDF and ePub downloads, according to the available data) and Abstracts Views on Vision4Press platform.
Data correspond to usage on the plateform after 2015. The current usage metrics is available 48-96 hours after online publication and is updated daily on week days.
Initial download of the metrics may take a while.