Fig. 7.
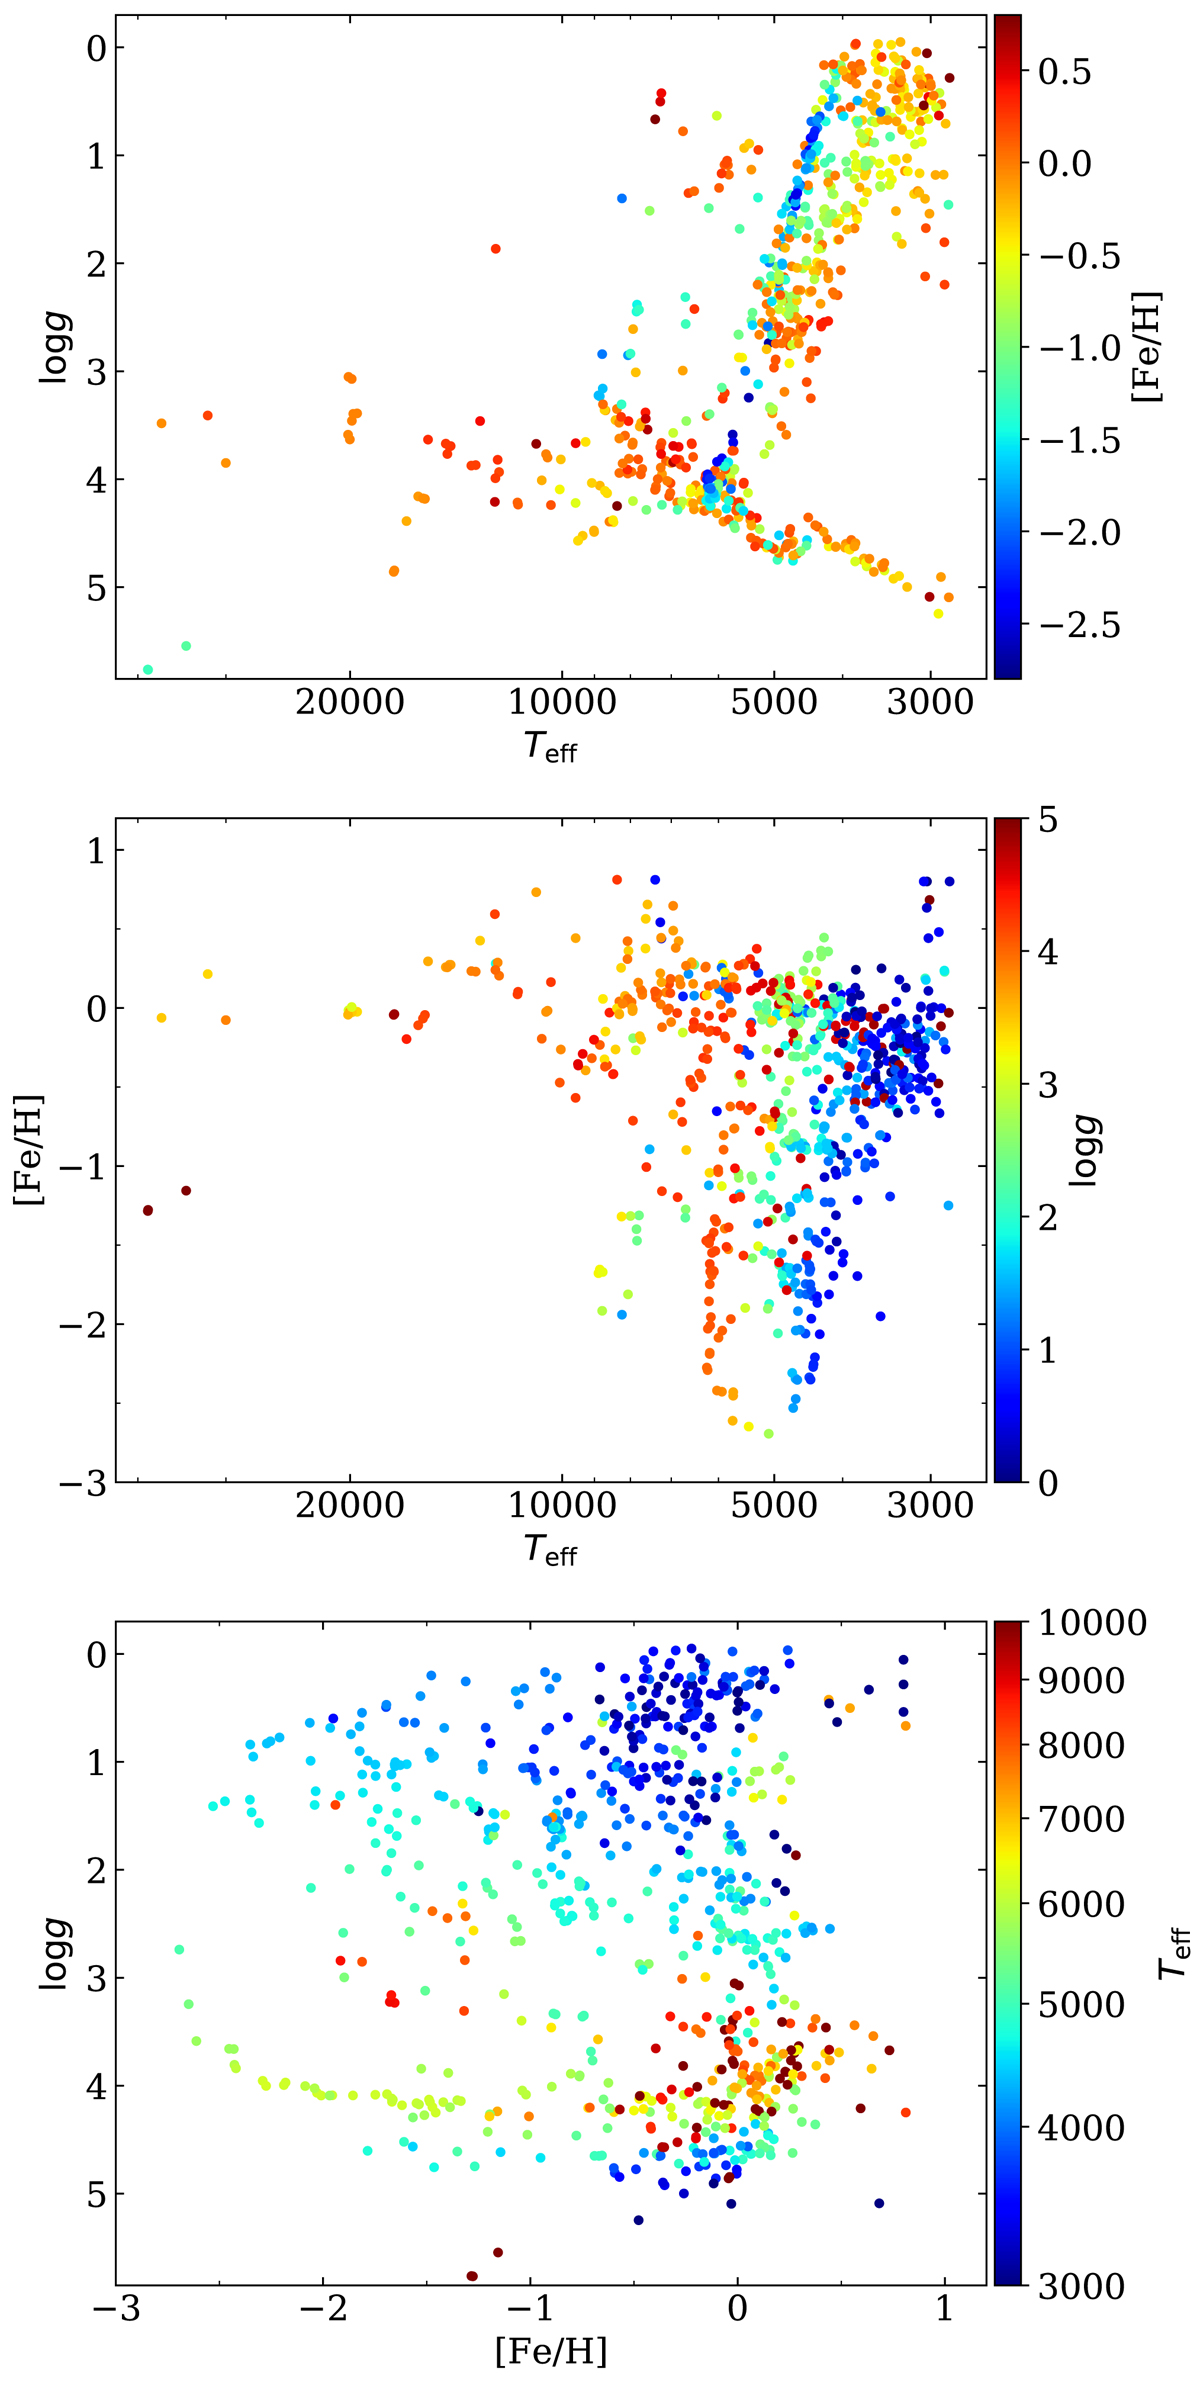
Final parameters in this paper for XSL. Top panel: Hertzsprung-Russell diagram for XSL, colour-coded by [Fe/H]. Middle: distribution in the Teff – [Fe/H] plane, colour-coded by logg. Bottom: distribution in the [Fe/H] – logg plane, colour-coded by logTeff. One star with a logg error larger than 2.0 is not shown (carbon star [ABC89] Cir 18).
Current usage metrics show cumulative count of Article Views (full-text article views including HTML views, PDF and ePub downloads, according to the available data) and Abstracts Views on Vision4Press platform.
Data correspond to usage on the plateform after 2015. The current usage metrics is available 48-96 hours after online publication and is updated daily on week days.
Initial download of the metrics may take a while.