Fig. 4.
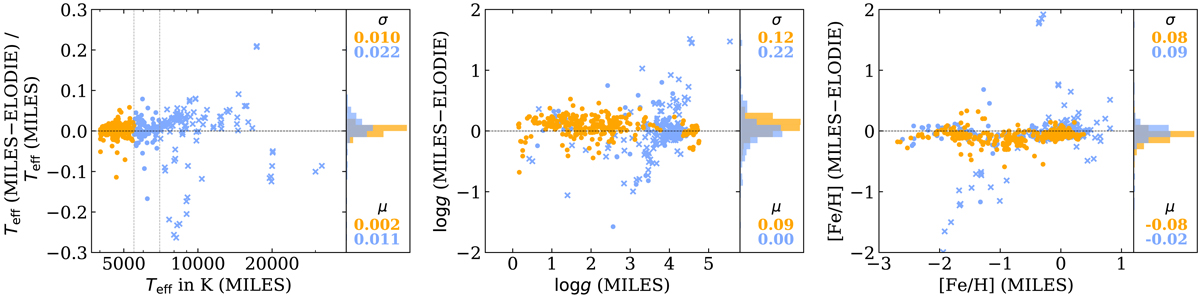
Comparison between the MILES and ELODIE solutions in the UVB for the stars with Teff (MILES)> 4000 K. Each atmospheric parameter is shown in a separate panel, and the colour of the symbols identify two temperature ranges (dividing at 5500 K). Stars hotter than 7000 K are shown as crosses. In the Teff and logg panels, seven and two outliers, respectively, are not shown (all hot stars). The dispersion σ and mean offset μ for the two temperature ranges are indicated.
Current usage metrics show cumulative count of Article Views (full-text article views including HTML views, PDF and ePub downloads, according to the available data) and Abstracts Views on Vision4Press platform.
Data correspond to usage on the plateform after 2015. The current usage metrics is available 48-96 hours after online publication and is updated daily on week days.
Initial download of the metrics may take a while.