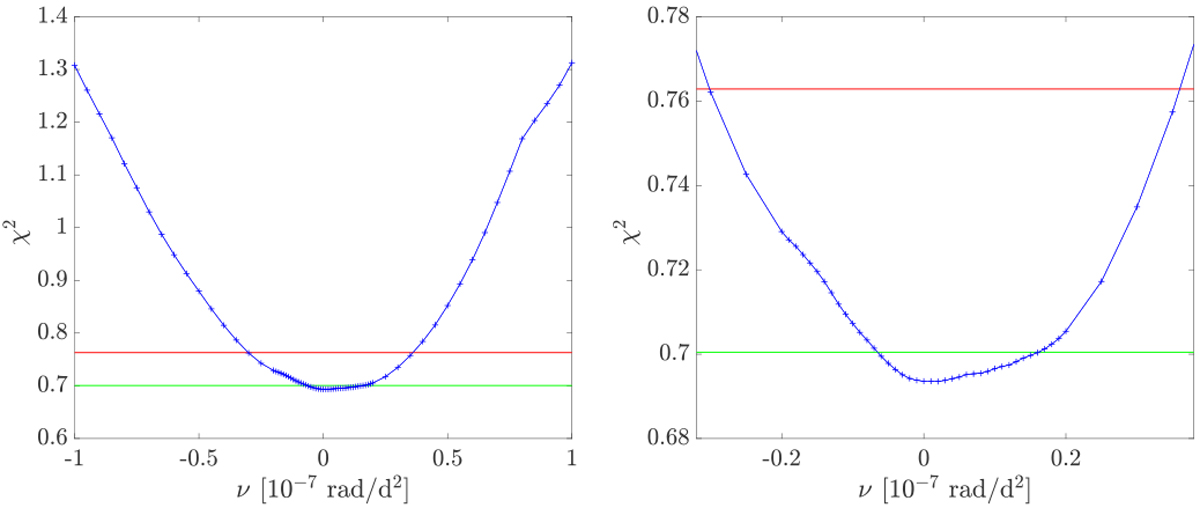
Fig. 4

YORP-factor fit to the light curve data. For each probed value of possible YORP-induced spin-up factor, ν, marked on the horizontal axis, a χ2-plane was constructed on a fragment of the celestial sphere, similar to the 0-YORP plane shown in Fig. 3. Minimum χ2 value, corresponding to the best solution from each plane, versus YORP factor are plotted with blue crosses. The horizontal lines mark the increases above the best-fit χ2 minimum: + 1% (green) and + 10% (red). A zoomed view is provided in the right panel and shows that there is a wide range of possible solutions including spin-up, spin-down, or no rotation period change.
Current usage metrics show cumulative count of Article Views (full-text article views including HTML views, PDF and ePub downloads, according to the available data) and Abstracts Views on Vision4Press platform.
Data correspond to usage on the plateform after 2015. The current usage metrics is available 48-96 hours after online publication and is updated daily on week days.
Initial download of the metrics may take a while.


