Fig. 2
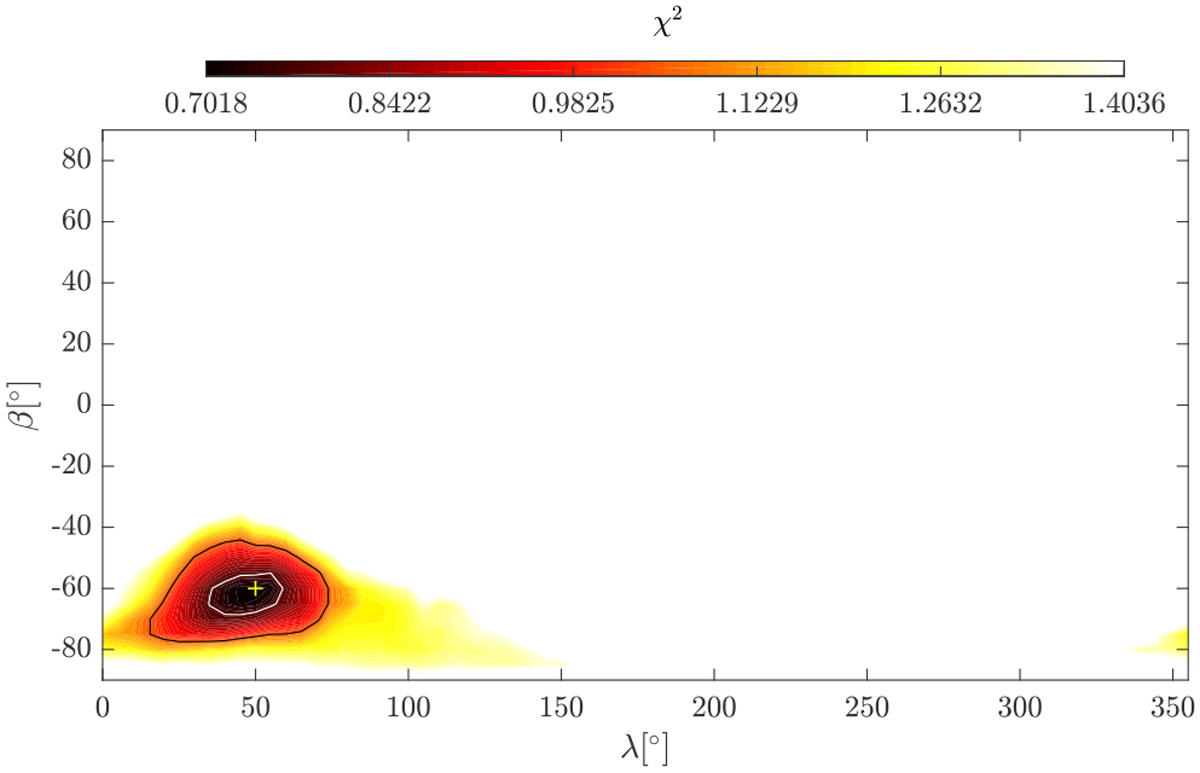
Goodness-of-fit χ2 plane for the pole scan for (1917) Cuyo with a constant rotation period. For a 5° × 5° grid of possible pole positions, in ecliptic longitude λ and latitude β, the shape model and sidereal rotation period were optimised. Goodness-of-fit χ2 values foreach model were recorded. They are colour coded, with darker colours marking the lower χ2 values and anything above twice the minimum value of χ2 is white. Thewhite contour line indicates a 10% increase relative to the minimum χ2 value obtained (marked with a “+”) and the black contour line is a 50% increase. The fragment of the celestial sphere was chosen with the smallest χ2 values, for a more detailed 1° × 1° scan, as shown in Fig. 3.
Current usage metrics show cumulative count of Article Views (full-text article views including HTML views, PDF and ePub downloads, according to the available data) and Abstracts Views on Vision4Press platform.
Data correspond to usage on the plateform after 2015. The current usage metrics is available 48-96 hours after online publication and is updated daily on week days.
Initial download of the metrics may take a while.