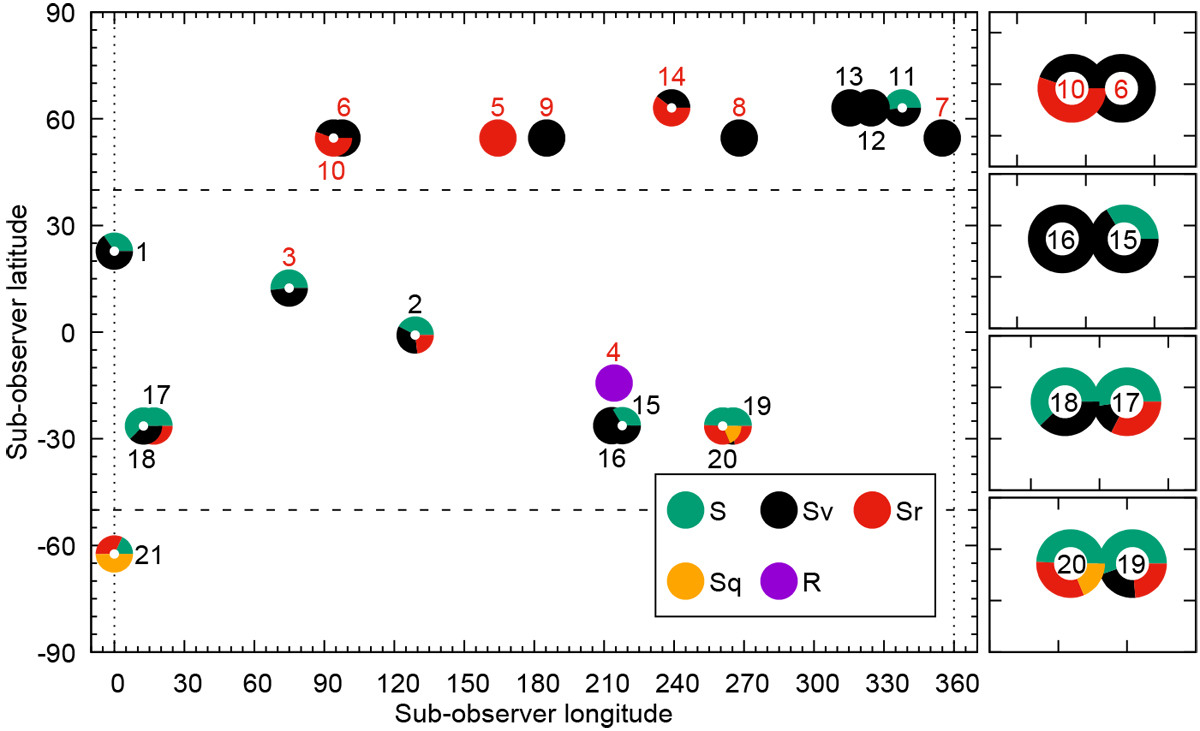
Fig. 12

Geometry at which each spectrum of Cuyo was taken. For each spectrum the location of the symbol is determined by sub-observer latitude and longitude in asteroid-centric coordinates. The spectra are labelled by their ID, as listed in Table 4. Spectra taken at near infrared wavelengths are labelled with red numbers, and at the optical wavelengths in black. The symbols are colour-coded and shown in the legend. Closed symbols are used for spectra where there was a very definitive match to one of the spectral classes, while open multi-coloured symbols are used to demonstrate the relative ambiguity in spectral class determination. On the right, we replot those cases where data points overlap, for clarity.
Current usage metrics show cumulative count of Article Views (full-text article views including HTML views, PDF and ePub downloads, according to the available data) and Abstracts Views on Vision4Press platform.
Data correspond to usage on the plateform after 2015. The current usage metrics is available 48-96 hours after online publication and is updated daily on week days.
Initial download of the metrics may take a while.


