Fig. 5.
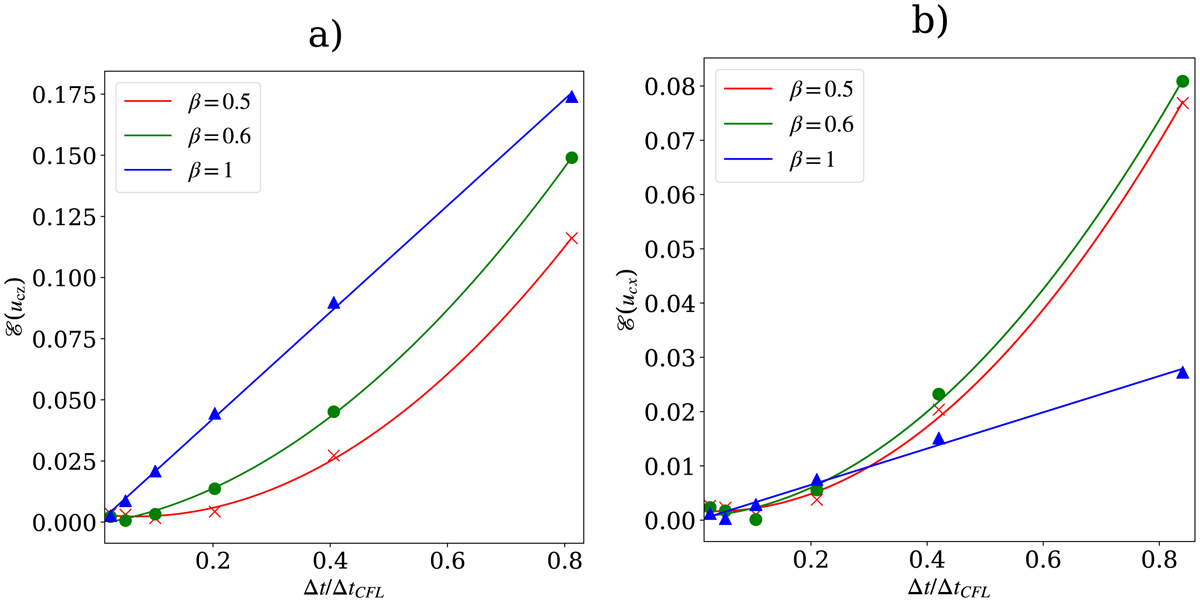
Normalized errors, ε, defined by Eq. (48), in the velocity of charges as a function of the ratio between the integration time step Δt and ΔtCFL, accumulated after running the simulation until t = tF. Panel a: simulations of acoustic waves, and panel b: simulations of Alfvén waves. Blue triangles show results for β = 1 (defined in Eq. (21)); green circles are for β = 0.6, and red crosses are for β = 0.5. Solid lines show the results of quadratic polynomial fit ε = a(Δt/ΔtCFL)2 + b(Δt/ΔtCFL)+c, with coefficients given in Tables 4 and 5.
Current usage metrics show cumulative count of Article Views (full-text article views including HTML views, PDF and ePub downloads, according to the available data) and Abstracts Views on Vision4Press platform.
Data correspond to usage on the plateform after 2015. The current usage metrics is available 48-96 hours after online publication and is updated daily on week days.
Initial download of the metrics may take a while.