Fig. 2.
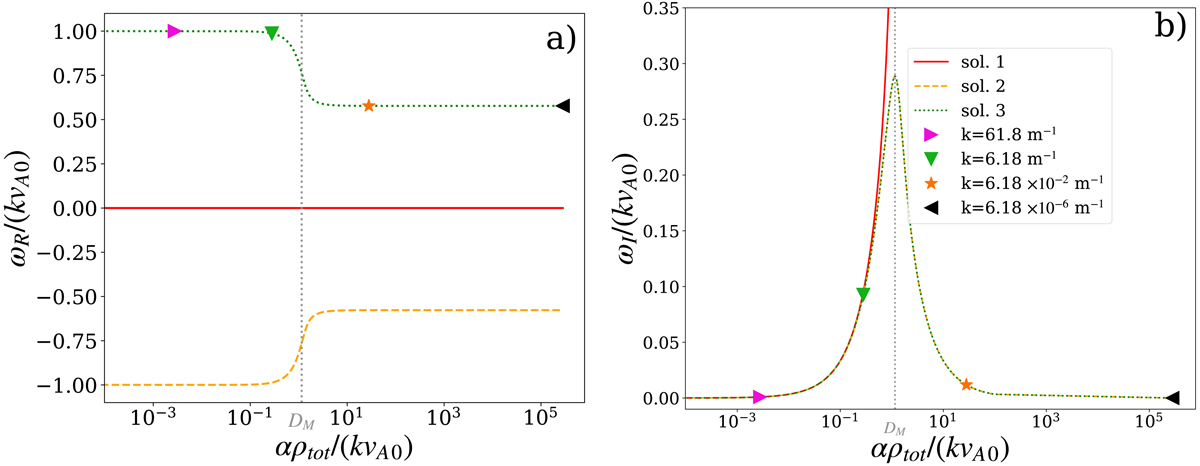
Solutions of the dispersion relation, Eq. (39), for the Alfvén wave case. Left and right panels present the real and imaginary parts of the wave frequency ω, respectively, as a function of the wavenumber k. The axes are scaled in the nondimensional units: C and D, defined in Eq. (40) for better visualization. Three solutions are marked with different colors and line styles: red solid for solution 1, orange dashed for solution 2, and green dotted for solution 3. The values of k for which we compare the analytical and numerical solutions using the values of ω, corresponding to solution 3 (green dots), are marked in the panels: pink triangle (k = 61.8 m−1), green triangle (k = 6.18 m−1), orange star (k = 6.18 × 10⁻² m−1), and black triangle (k = 6.18 × 10⁻⁶ m−1).
Current usage metrics show cumulative count of Article Views (full-text article views including HTML views, PDF and ePub downloads, according to the available data) and Abstracts Views on Vision4Press platform.
Data correspond to usage on the plateform after 2015. The current usage metrics is available 48-96 hours after online publication and is updated daily on week days.
Initial download of the metrics may take a while.